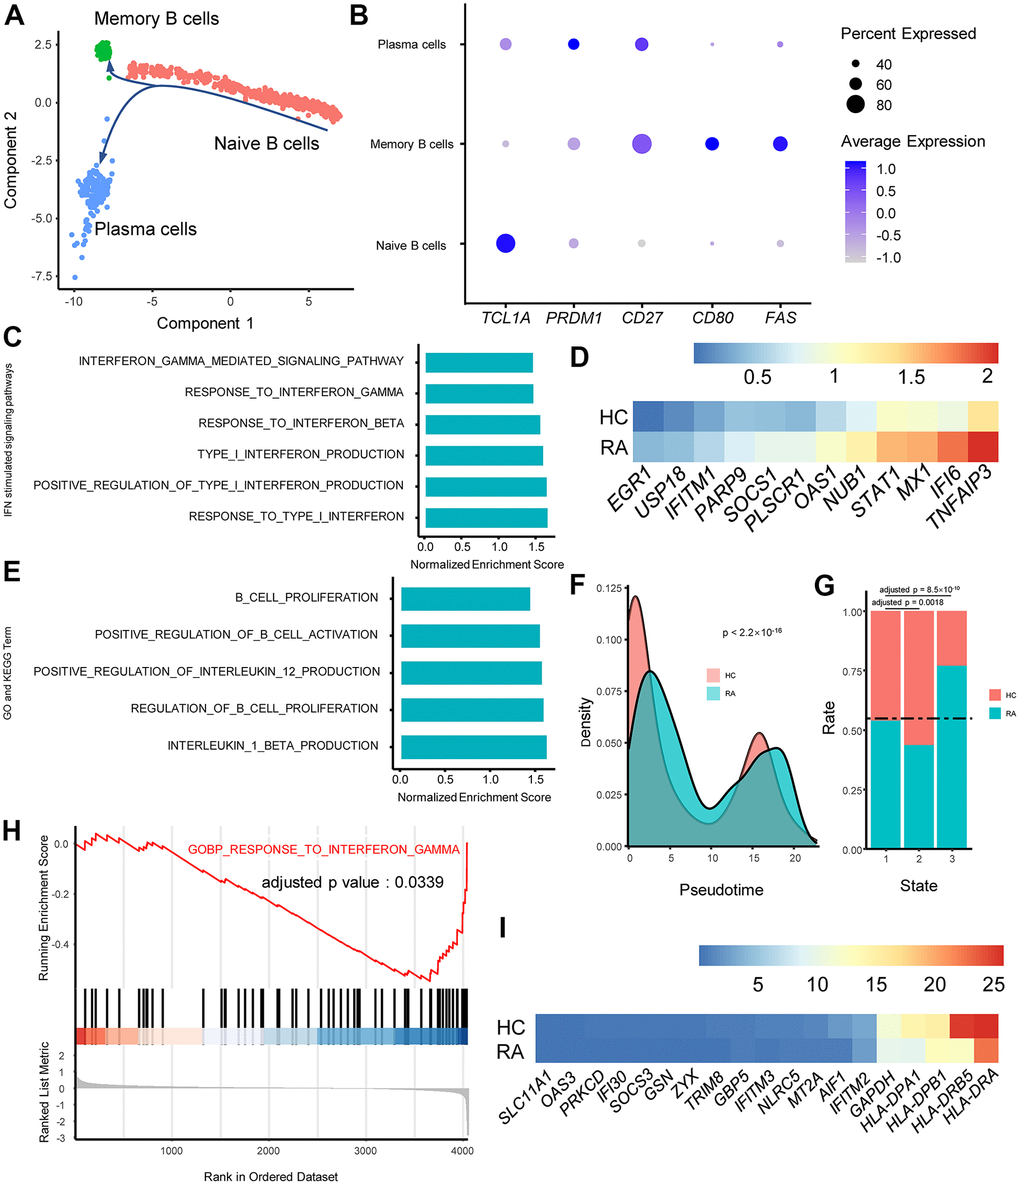
Figure 6.IFN alters rheumatoid arthritis (RA) B cell proliferation and activation and class switching in RA plasma cells. (A) Trajectory plots of T cells from RA and healthy control individuals (HC). The direction of arrows indicates the direction of pseudotime. (B) Dot plot illustrating the expression levels of several marker genes in three T cell subtypes. (C) Bar plots of selected gene set enrichment analysis (GSEA) results indicate activated IFN signaling pathways in RA naïve B cells. (D) Heat map of upregulated type I IFN stimulated genes in RA naïve B cells. Genes are ordered according to their expression levels in RA naïve B cells. (E) GSEA results indicate activated B cell functions in RA naïve B cells. (F) Probability density plot of B cell pseudotimes in RA and HC. Pseudotimes between the RA patients and HCs were compared using the Mann-Whitney U test. (G) Stacked bar plot of B cell subtype distribution in RA and HC. The horizontal dotted line indicates the overall B cell proportions in RA and HC. The proportions of memory B cells and plasma cells in the RA patient and HCs were compared to the proportions of naïve B cells, and comparisons were performed using Fisher’s exact test. (H) GSEA plot of the “GOBP_RESPONSE_TO_INTERFERON_GAMMA” pathway in RA plasma cells. (I) Heat map of downregulated IFN-γ-stimulated genes in RA plasma cells. Genes are ordered according to their expression levels in HC naïve B cells.