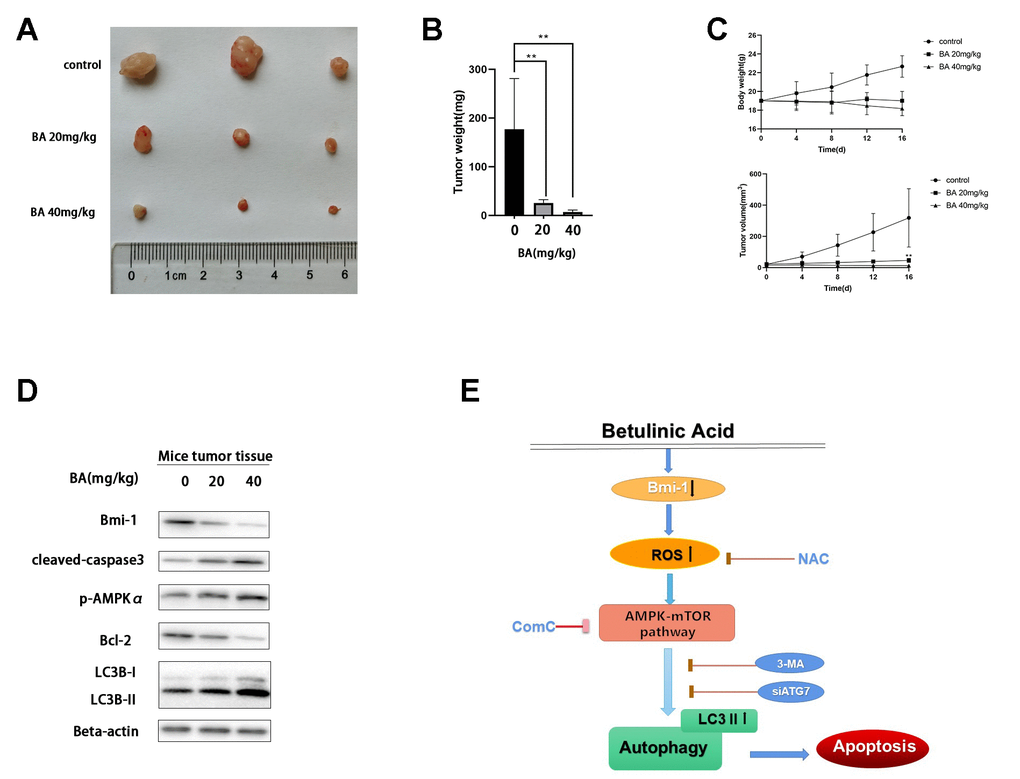
Figure 9.BA represses T24 cell tumor xenograft growth in vivo. (A, B) Tumor volume measurements. (C) Tumor weight measurements. (D) Western blot assessment of Bmi-1, cleaved caspase-3, p-AMPKα, Bcl-2, and LC3B-II expression in excised xenograft tumor tissues. (E) Schematic of this study results.