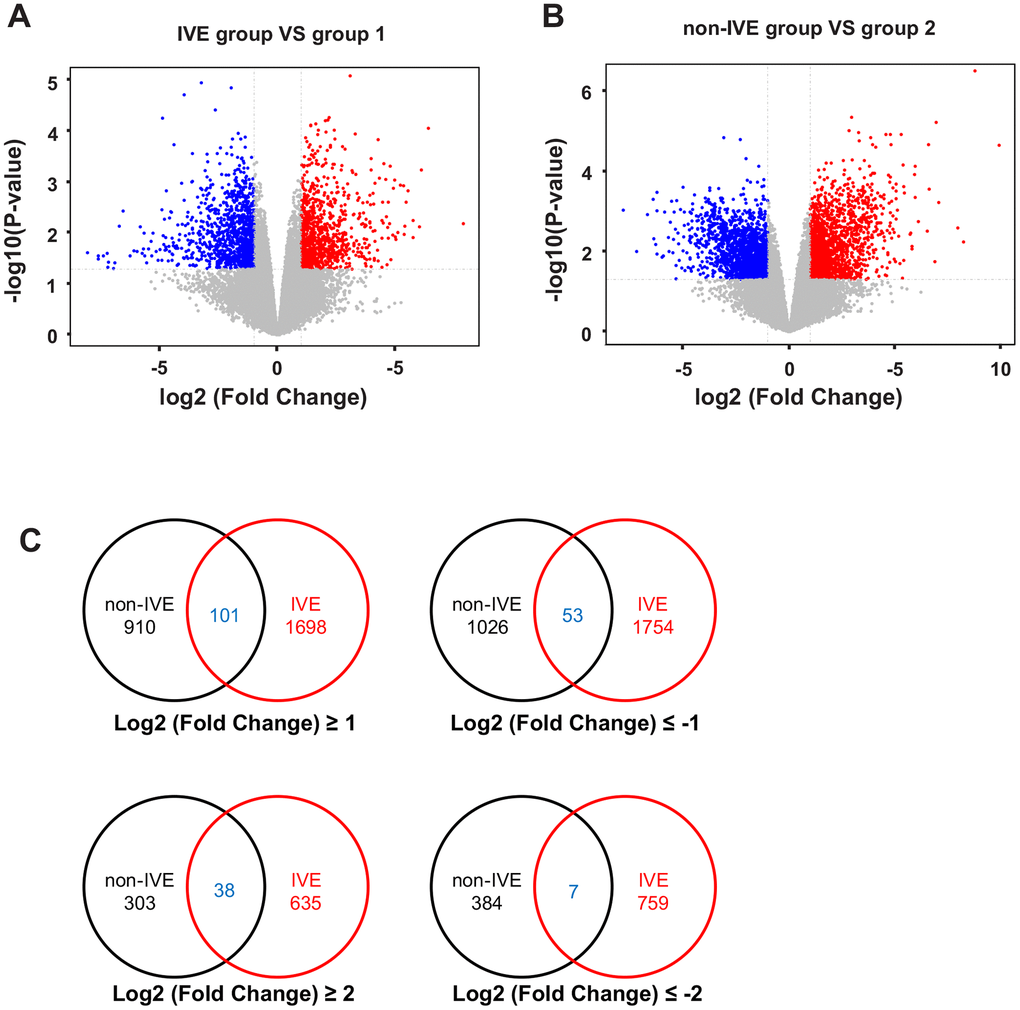
Figure 3.Analysis of DEGs in non-IVE and IVE groups compared with their paired normal groups. (A) Volcano plot of DEGs between the IVE and paired group 1. (B) Volcano plot of DEGs between IVE and paired group 2. For (A, B), Genes significantly up-regulated are highlighted in red while down-regulated genes are highlighted in blue. The P-value threshold and cutoff of absolute fold change were <0.05 and >2, respectively. (C) Venn diagrams indicating the number of DEGs in each group and common DEGs. IVE, IVE group versus paired group 1; non-IVE: non-IVE group versus paired group 2.