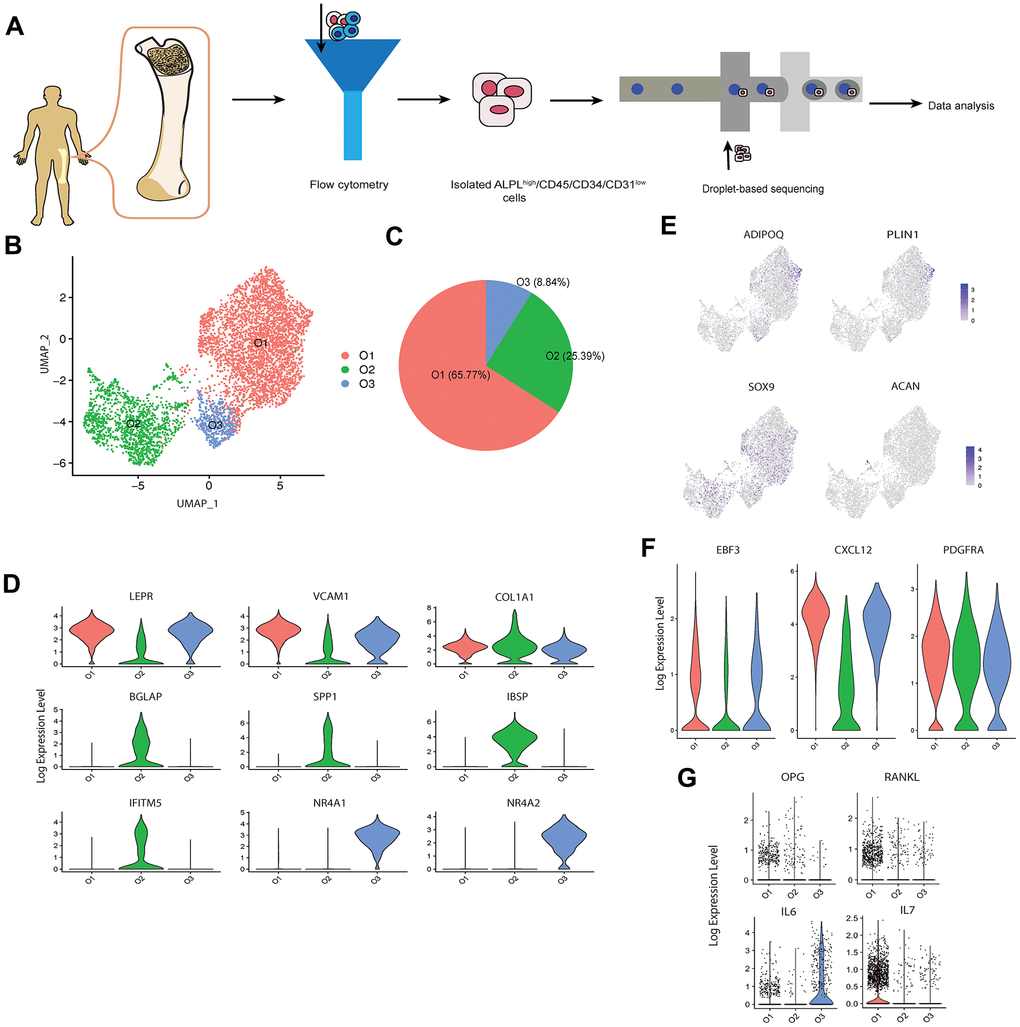
Figure 1.scRNA-seq analysis of human osteoblasts. (A) Study overview. (B) Three osteoblast clusters. UMAP visualization of 5,329 osteoblasts, colored by clustering. (C) Proportion of three osteoblast clusters. Colored by clustering. (D) Cluster signature genes. Violin plots showing the log-transformed normalized expression levels of the two most significant marker genes in clusters O1, O2, and O3, respectively. (E) Log-normalized expression of adipocyte and chondrocyte biomarkers in osteoblast clusters. (F) Log-normalized expression of LEPR+ mesenchymal cell related markers in osteoblast clusters. (G) Log-normalized expression of OPG, RANKL, IL6, and IL7 in three clusters.