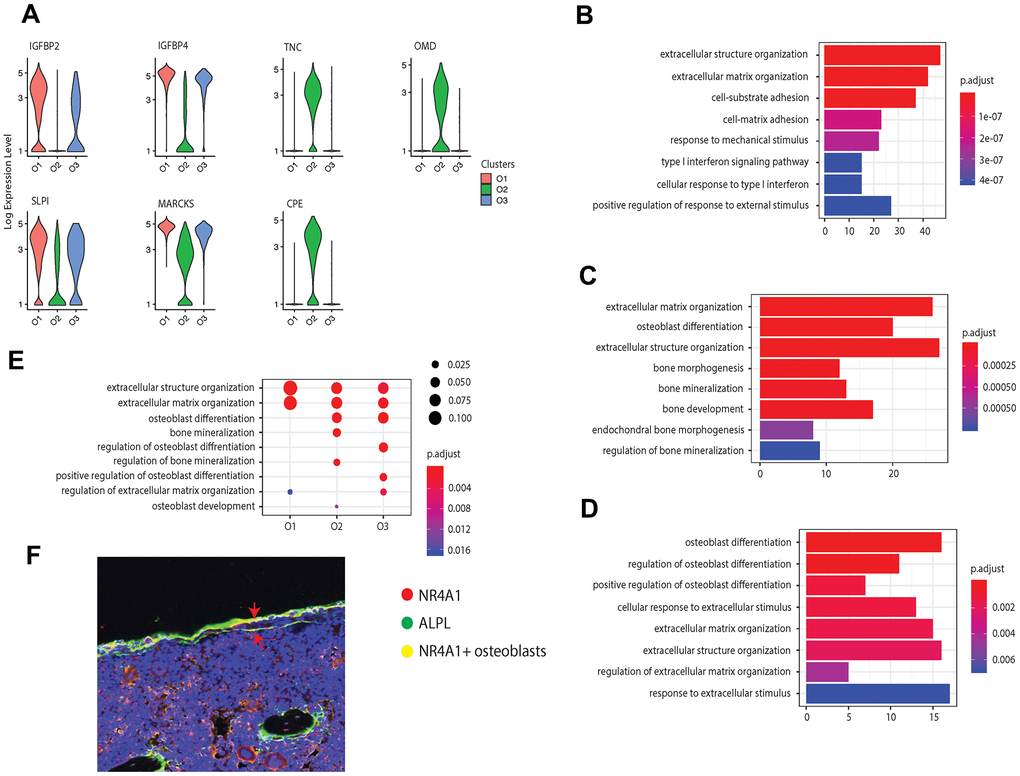
Figure 2.Osteoblast subtypes and cellular functions in bone formation. (A) Osteoblasts related genes expressed in clusters O1, O2, and O3, respectively. (B–D) GO enrichment for the three osteoblast subpopulations, O1, O2, and O3, respectively. The length of the bar indicates the gene ratio (number of DEGs enriched in the GO term / total number of DEGs). The color indicates the adjusted p values for enrichment analysis. (E) Bone formation related GO terms enriched in clusters O1, O2, and O3. The size of dot indicates the gene ratio, which is the ratio of functional related genes and the total number of the differential expression genes compared with other clusters. The color indicates the adjusted p-value for enrichment analysis. (F) Immunofluorescence of mouse femur. The osteoblast marker ALPL was stained by green, while the cluster O3 marker NR4A1 was stained by red. The undetermined osteoblasts were located on the bone surface, co-stained by green and red (yellow).