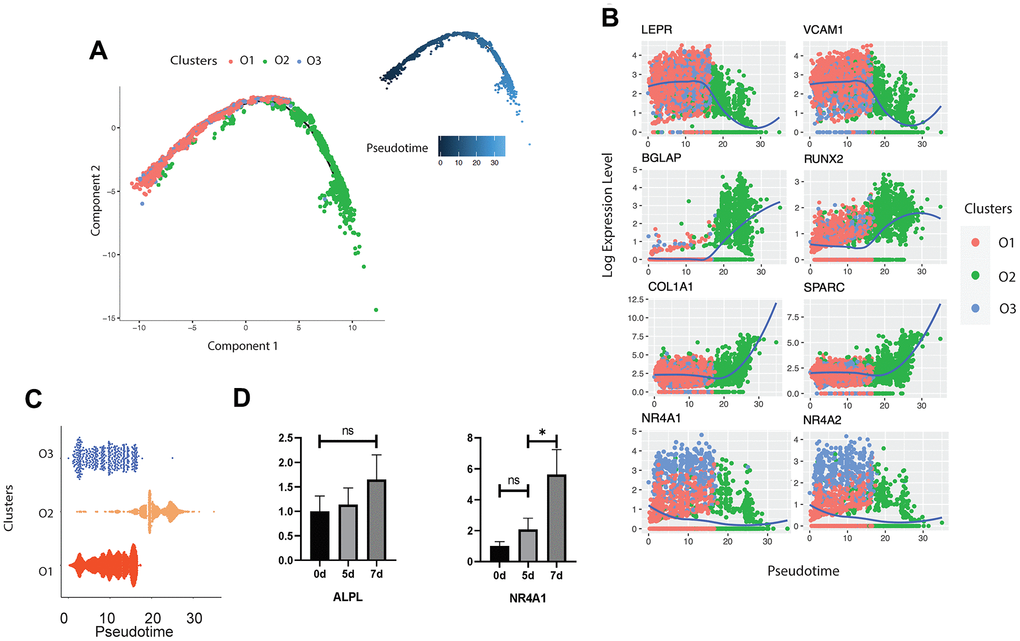
Figure 3.Trajectory inference of human osteoblasts. (A) Reconstructed cell differentiation trajectory of human osteoblasts. The upper-right trajectory plot in the square indicates the direction of pseudotime. (B) Expression levels (log-normalized) of indicated genes in the three osteoblast subtypes with respect to their pseudotime coordinates. The x-axis indicates the pseudotime, while the y-axis represents the log-normalized gene expression levels. The color corresponding to the three different osteoblast subsets. The loess regression was applied to fit the relationship between pseudotime and expression level. (C) Cell distribution based on the pseudotime coordinates. The x-axis is the pseudotime and the y-axis represents the osteoblast subtypes. (D) Expression levels of ALPL and NR4A1 in mouse osteoblasts in vitro at day 0, 5 and 7, respectively. N.S., not significant, *p-adjusted ≤ 0.05, **p-adjusted≤ 0.01, *** p-adjusted ≤ 0.005.