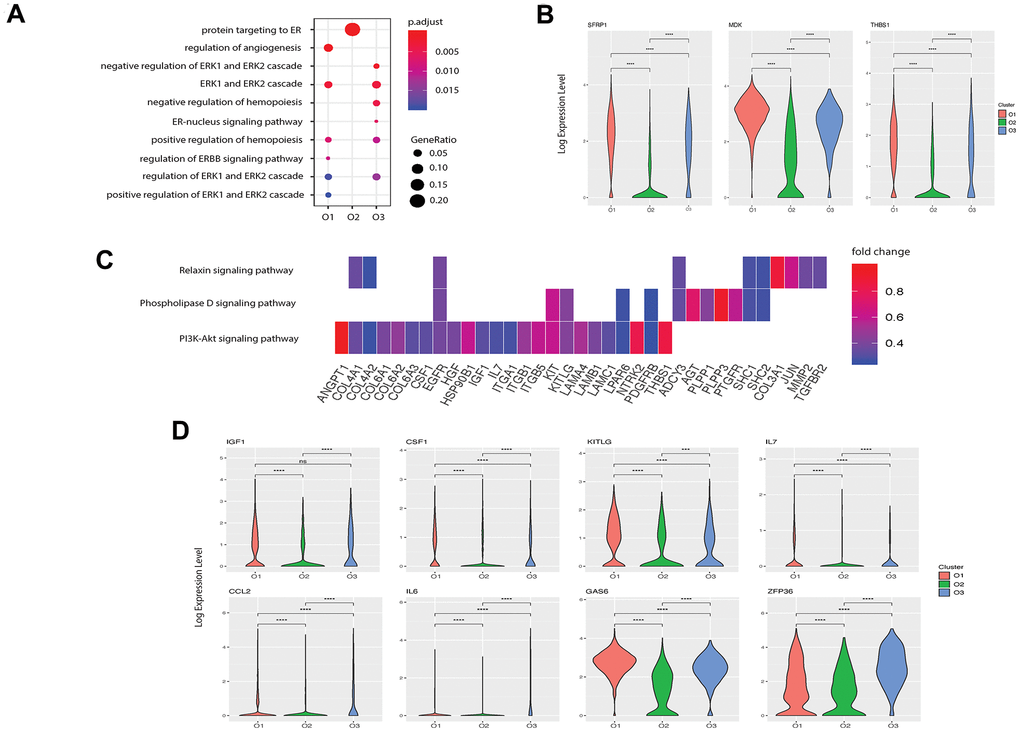
Figure 4.Potential functions of pre- and undetermined osteoblasts in angiogenesis and hemopoiesis. (A) Angiogenesis and hematopoiesis modulation related GO terms enriched in the three clusters. The x-axis represents the clusters and the y-axis is the GO terms related to the angiogenesis and hematopoiesis regulation. The size of the dot indicates the gene ratio and the color indicates the adjusted p-values. (B) Angiogenesis associated genes enriched in cluster O1. X-axis represents the three clusters and y-axis reflects log-normalized gene expression levels. Stars indicate the significance levels of the gene expression difference between two clusters by Wilcoxon signed-rank test. N.S., not significant, *p-adjusted ≤ 0.05, **p-adjusted ≤ 0.01, *** p-adjusted ≤ 0.005. (C) Gene expression pattern in enriched pathways. Squares show enriched DEGs in the corresponding terms (rows). Color indicates the expression value of the DEGs (average logFC). (D) Hemopoiesis factors enriched in clusters O1 and O3.