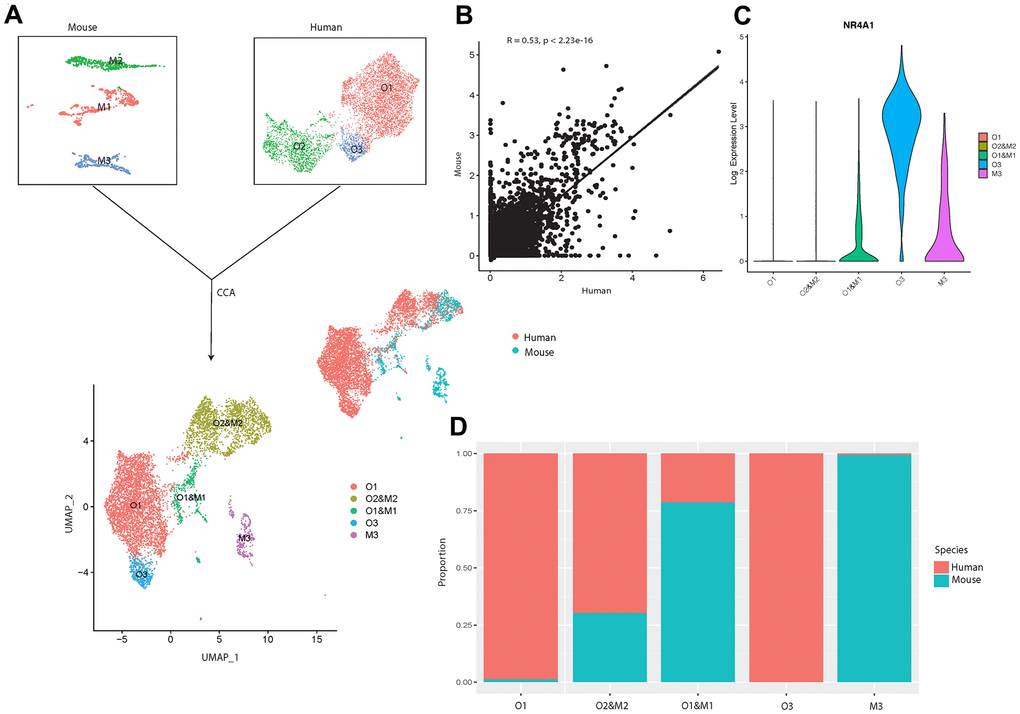
Figure 5.Integrated cross-species analysis between human and mouse osteoblasts in vivo. (A) UMAP visualization of human and mouse osteoblast integration. The upper-left plot represents the three osteoblast clusters in mice, the upper-right plot indicates the three osteoblast subtypes in humans. The bottom plot represents the five clusters after the integration, colored by clusters. The middle-right is the integrated data colored by different species. (B) Correlation of gene expression among different osteoblast datasets after CCA integration. Each dot represents an individual gene. Axes measure the average gene expression levels (logFC) in the indicated subject. Correlations were measured by Spearman correlation coefficients (R) (p < 0.01). (C) Log-normalized expression of NR4A1 in human and mouse integrated data. (D) Proportion of the human and mouse osteoblasts in each cluster after CCA integration, colored by different species. The x-axis represents five different clusters and y-axis indicates the proportion.