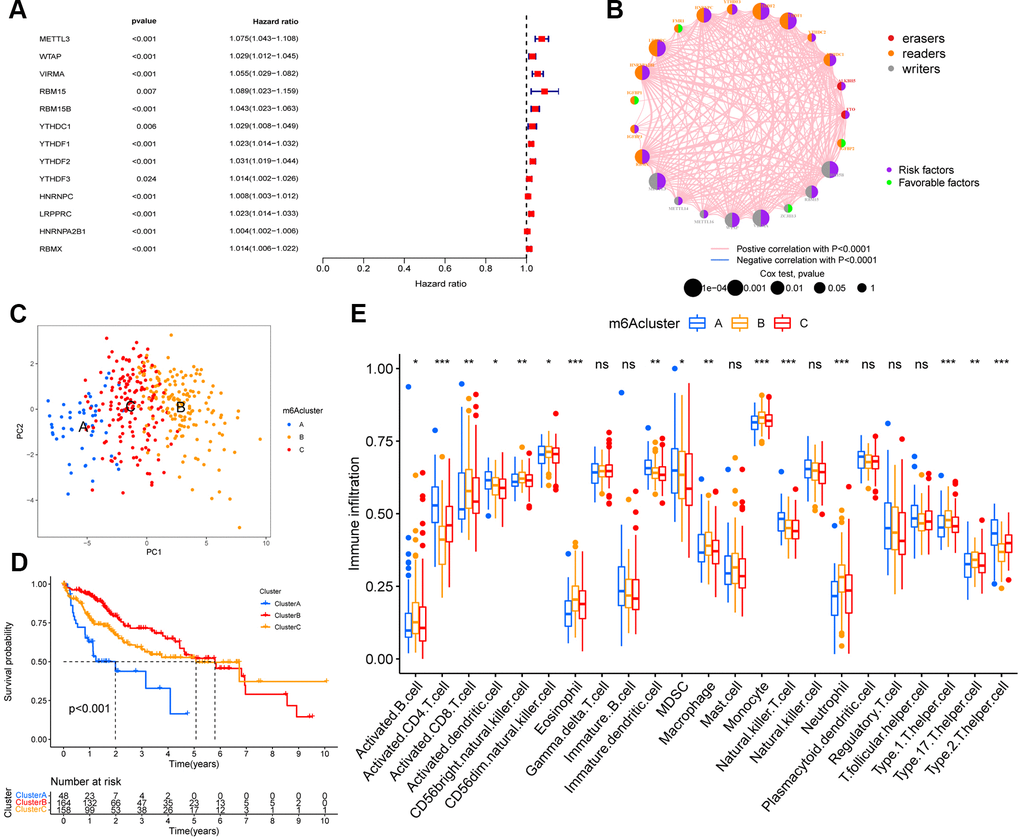
Figure 2.m6A methylation modification pattern and relevant immune infiltration. (A) Prognosis of 23 m6A regulators was analyzed using univariate Cox regression models. METTL3, WTAP, VIRMA, RBM15, RBM15B, YTHDC1, YTHDF1, YTHDF2, YTHDF3, HNRNPC, LRPPRC, HNRNPA2B1, RBMX were risk factors (Hazard ratio >1). (B) Interactions between m6A regulators in hepatocellular carcinoma. The size of the circles represents the effect of each modulator on prognosis, with larger circles having a greater effect on prognosis (p-values from 1 to 0.0001). Circles with purple and green colors indicate prognostic risk and protective factors respectively. The line connecting the m6A regulators represents the correlation between the m6A regulators, with negative correlations marked in blue and positive correlations marked in pink. (C) Principal component analysis (PCA) analysis of m6A methylation modification pattern. (D) The overall survival of m6A methylation modification pattern using Kaplan–Meier curves. (E) Differences in immune cell infiltration of m6A methylation modification pattern (*, P < 0.05; **, P < 0.01; ***, P < 0.001; ns, no significant; Kruskal–Wallis test).