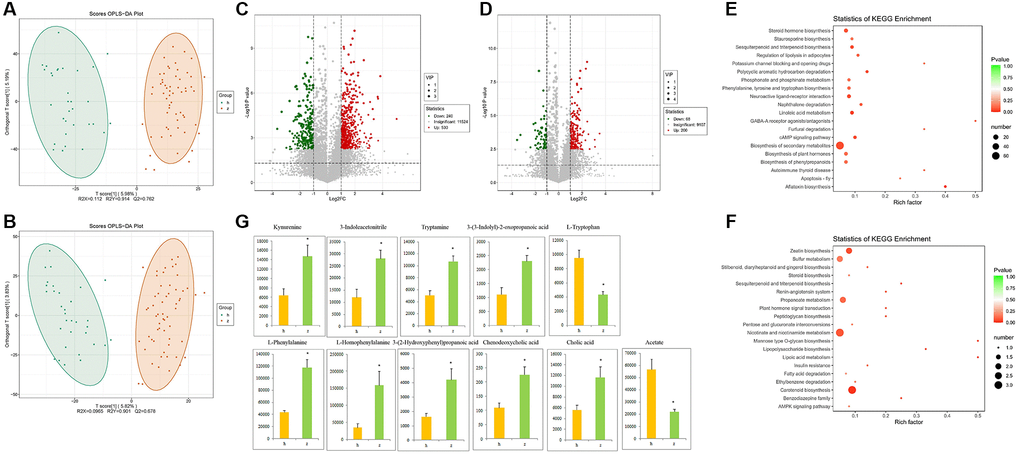
Figure 3.Fecal metabolomics analysis. (A) OPLS-DA score plots in positive ion mode. (B) OPLS-DA score plots in negative ion mode. (C) Differentially regulated metabolites in positive ion mode. (D) Differentially regulated metabolites in negative ion mode. (E–F) KEGG pathway analysis of differentially expressed metabolites in positive and negative ion modes. (G) Representative differential metabolites. Data are mean ± SE; h: control group; z: NHS group; *P < 0.05.