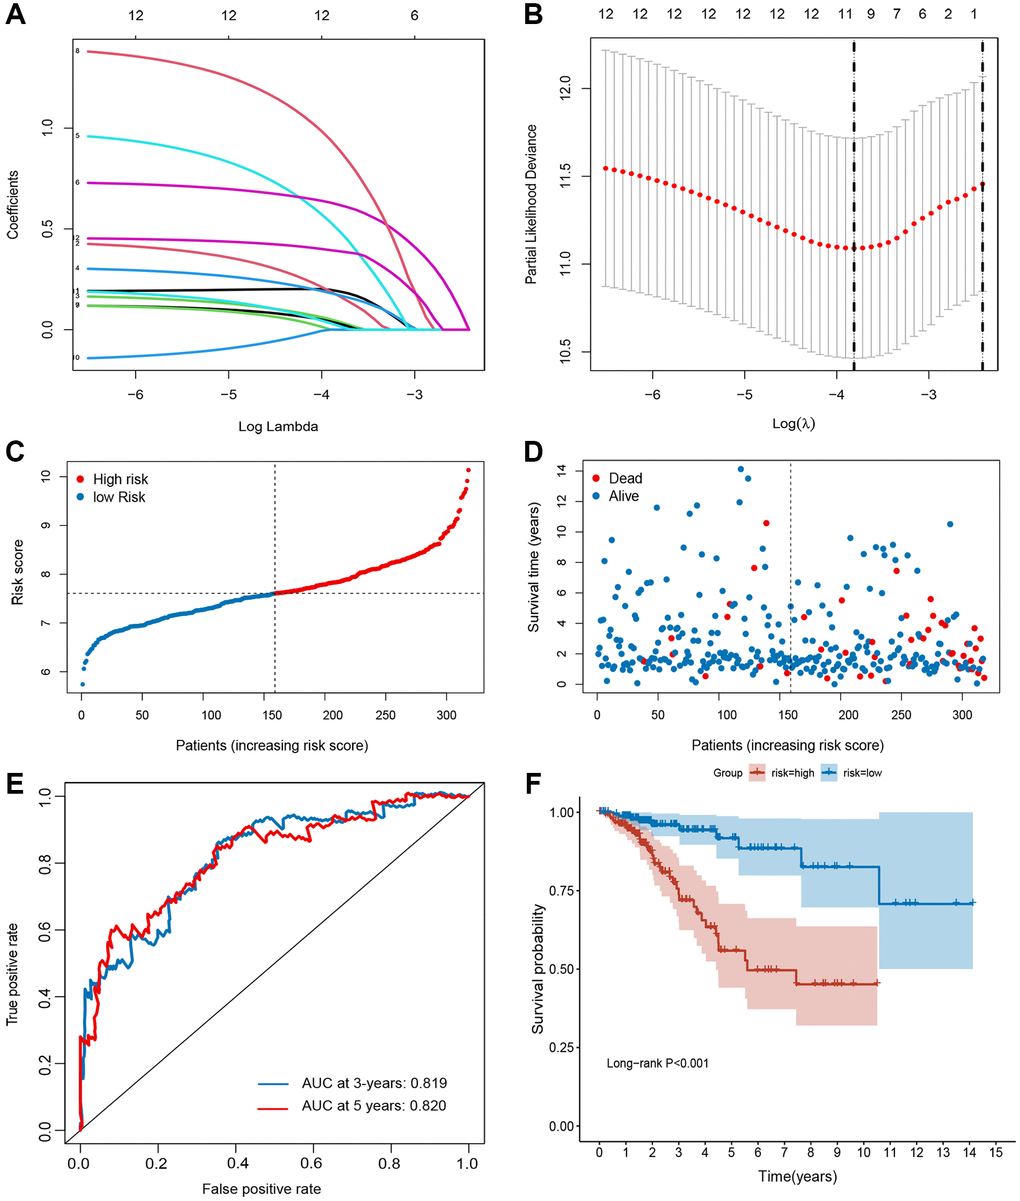
Figure 2.Establishment of ferroptosis-related gene signature in TCGA set. (A and B) The LASSO regression analysis and partial likelihood deviance of the 12 prognosis-associated FRGs. (C) The ranked dot plot indicates the risk score distribution. (D) Scatter plot illustrates the patients’ survival status. (E) ROC curve of 10-FRG signature. (F) Kaplan-Meier method was used to plot the RFS curve for the high-risk and low-risk score groups.