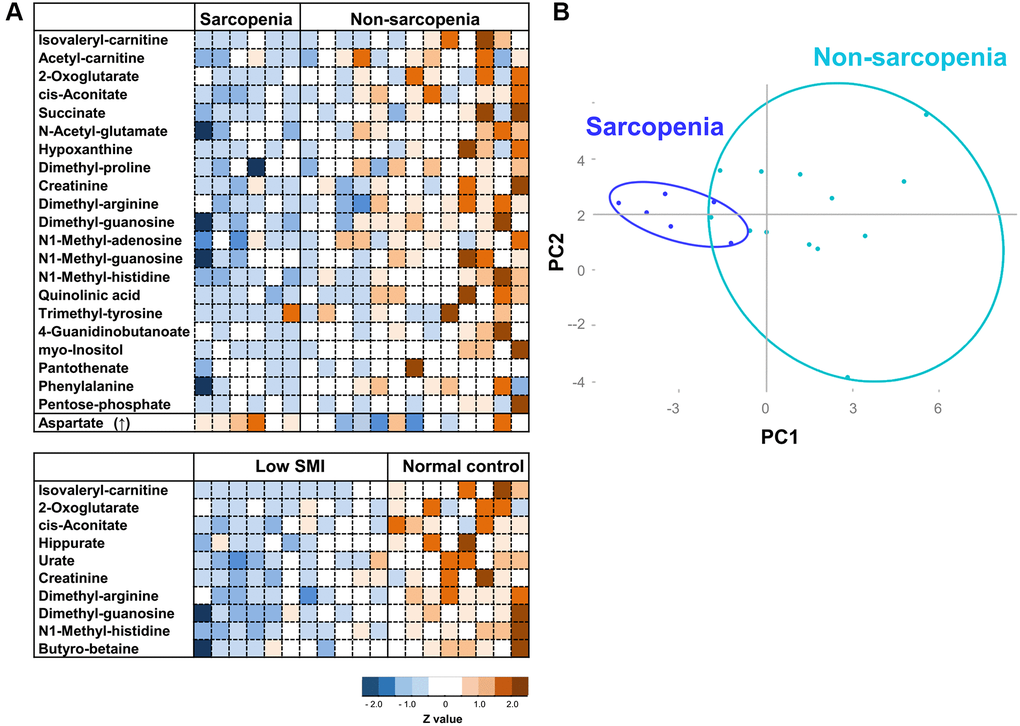
Figure 4.Heatmap analysis and PCA for sarcopenia. (A) Heatmap analysis of metabolites involved in sarcopenia (top panel), and SMI (bottom). The heat map shows Z-scores of peak areas from LC-MS analysis. (B) PCA plot of 19 elderly participants. 22 sarcopenia markers were analyzed.