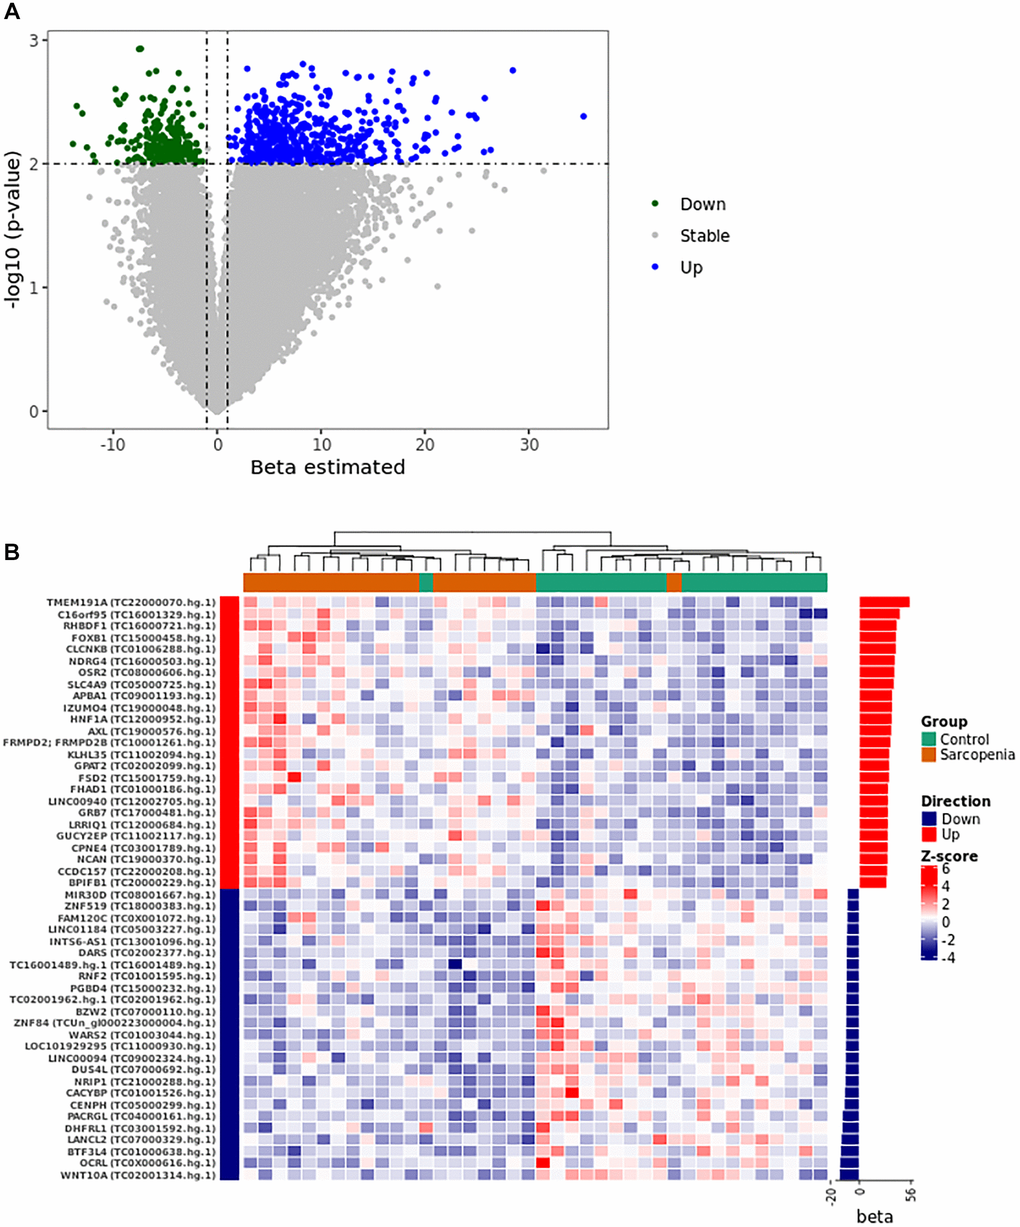
Figure 1.Gene expression pattern from the logistical regression analysis. (A) The volcano plot was constructed using the full list of 67528 transcript clusters analyzed. The top 821 transcripts were highlighted in blue (556 PPR) and green (255 PNR). A p-value of <0.01 and |beta| >1 was considered statistically significant. (B) The heat map shows the unsupervised clustering of the normalized expression pattern. The dendrogram indicates two clusters that stratified LMM and control group in distinct clusters. The right panel of the heat map shows the bar graph of beta coefficient values. Abbreviations: Beta: Estimated logistic regression coefficient; PPR: Predictor with Positive Relationship also called Up in panel A and B; PNR: Predictor with Negative Relationship also called Down in panel A and B.