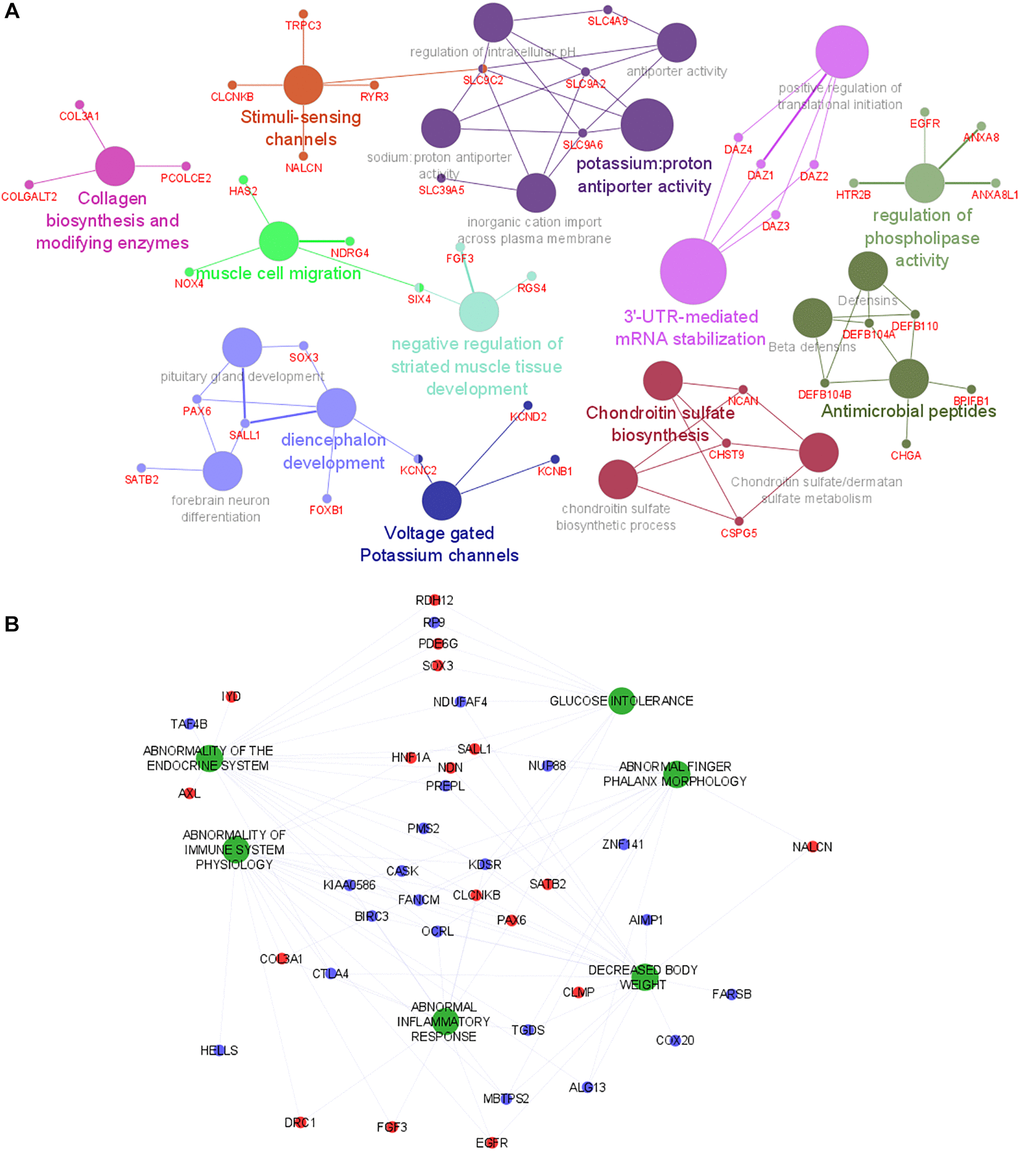
Figure 2.Functional analysis of genes and human phenotypes associated with LMM. (A) Pathways that are associated with the gene discriminated in the logistic regression (with positive coefficient) are indicated by colored nodes. GSA terms are interconnected with their associated genes. Related GSA terms are indicated by the same color. (B) The human phenotype ontologies are presented in green and shared genes are represented as red (positive coefficient) and blue (negative coefficient) dots. Abbreviation: GSA: Gene Set Analysis.