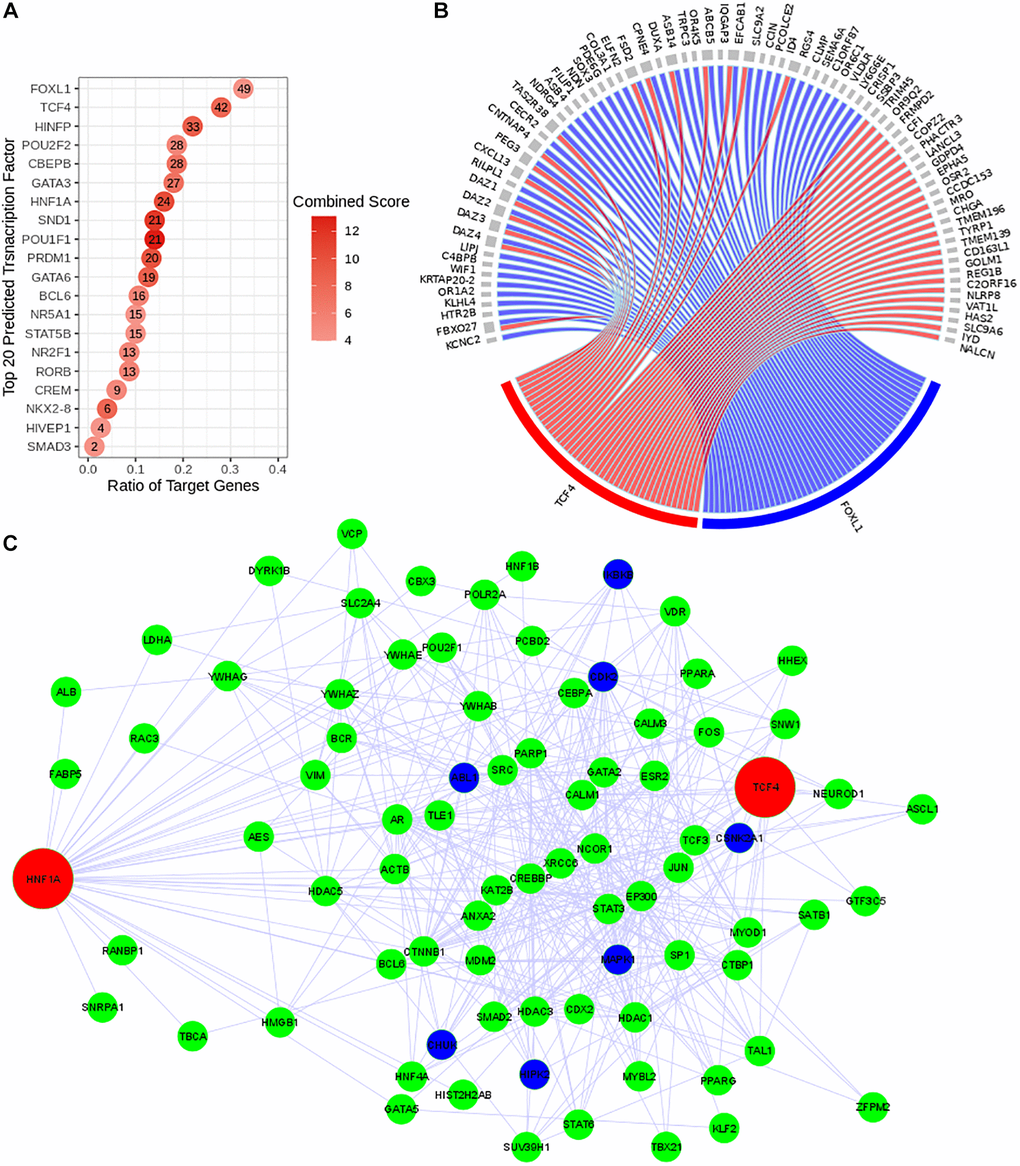
Figure 3.Reconstruction of the predicted transcriptional regulatory network. TF regulatory network was reconstructed using Expression2Kinase tool. (A) Top 20 predicted TFs were presented and ranked based on their combined scores. The intensity of the red coloration is proportional to the combined scores. The ratio of the target genes (x axis) indicates the proportion of genes targeted by a determined TF. (B) The circos diagram shows the interaction between the top two predicted TFs (TCF4 in red and FOXL1 in blue), ranked by the ratio of target genes) and their targeted genes (gray). Both TFs target 16 common genes. (C) Co-regulatory network of TCF4 and HNF1A. The transcriptional regulatory network is presented with the transcription factors (TFs) in red, the intermediate protein that are predicted to interact with these TFs in green and the kinases in dark blue.