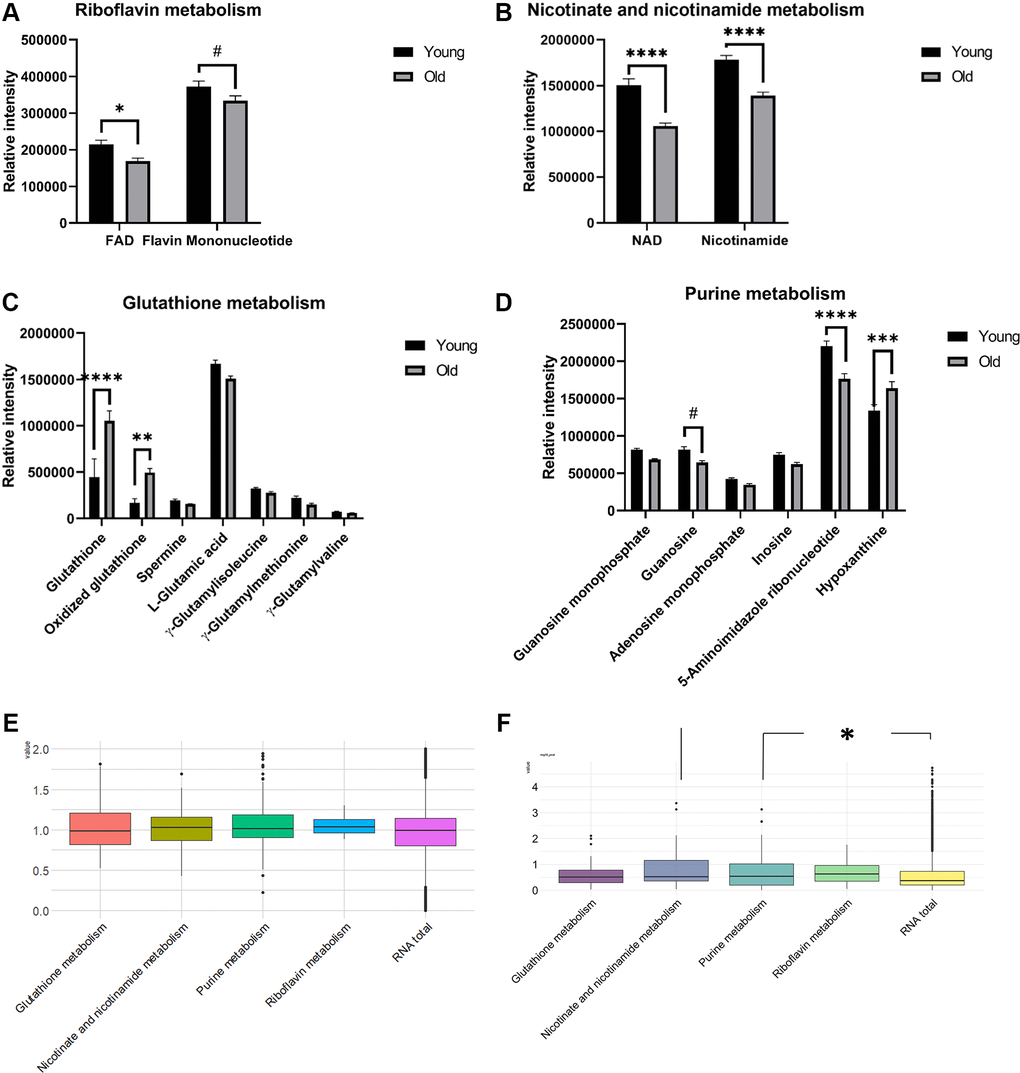
Figure 3.Barplots of the relative intensities of metabolites in differential pathways in aged mouse kidney tissues (A–D, n = 7 and 8 for young and old groups, respectively). The means and SEMs of the relative intensities determined by LC-MS are plotted. P-values were calculated by two-way ANOVA with Sidak’s multiple comparison tests to see intergroup differences for (A–D). Boxplots of the log2 transformed fold changes of genes annotated in differential pathways (E, n = 3 for both the young and old groups). Boxplots of the –log10(P-values) determined by t-tests to assess the differential expression of genes between the old and young groups (F, n = 3 for both the young and old groups). The distributions of –log10P values from each pathway were tested and compared to those in the whole transcriptome by Wilcoxon rank-sum tests. (p-values: #< 0.1, *< 0.05, **< 0.01, ***< 0.001, ****< 0.0001).