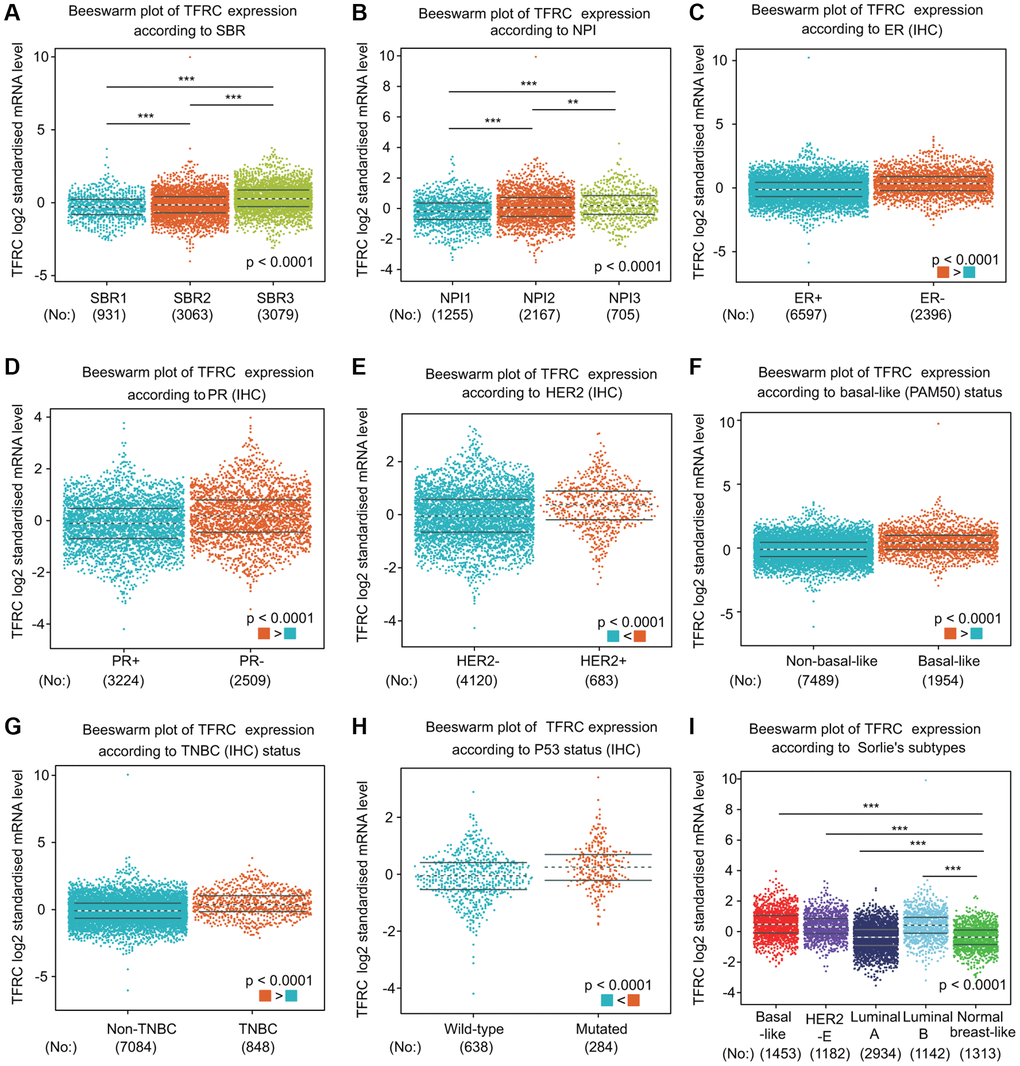
Figure 4.TfR1 expression in BC patients based on different pathological parameters was assessed using bc-GenExMiner v4.5. Box plots are shown for (A) SBR grade (SBR1, n = 931; SBR2, n = 3063; and SBR3, n = 3079), (B) NPI index (NPI1, n = 1255; NPI2, n = 2167; and NPI3, n = 705), (C) ER status (ER+, n = 6597; ER-, n = 2396), (D) PR status (PR+, n = 3224; PR-, n = 2509), (E) HER-2 status (HER2+, n = 683; HER2-, n = 4120), (F) basal-like status (non-basal-like, n = 7489; basal-like, n = 1954), (G) TNBC status (non-TNBC, n = 7084; TNBC, n = 848), (H) TP53 status (wild type, n = 638; mutated, n = 284), and (I) Sorlie subtypes (basal-like, n = 1453; luminal A, n = 2934; luminal B, n = 1142; HER2-E, n = 1182; and normal breast-like, n = 1313). *< 0.05, **< 0.01, ***< 0.001.