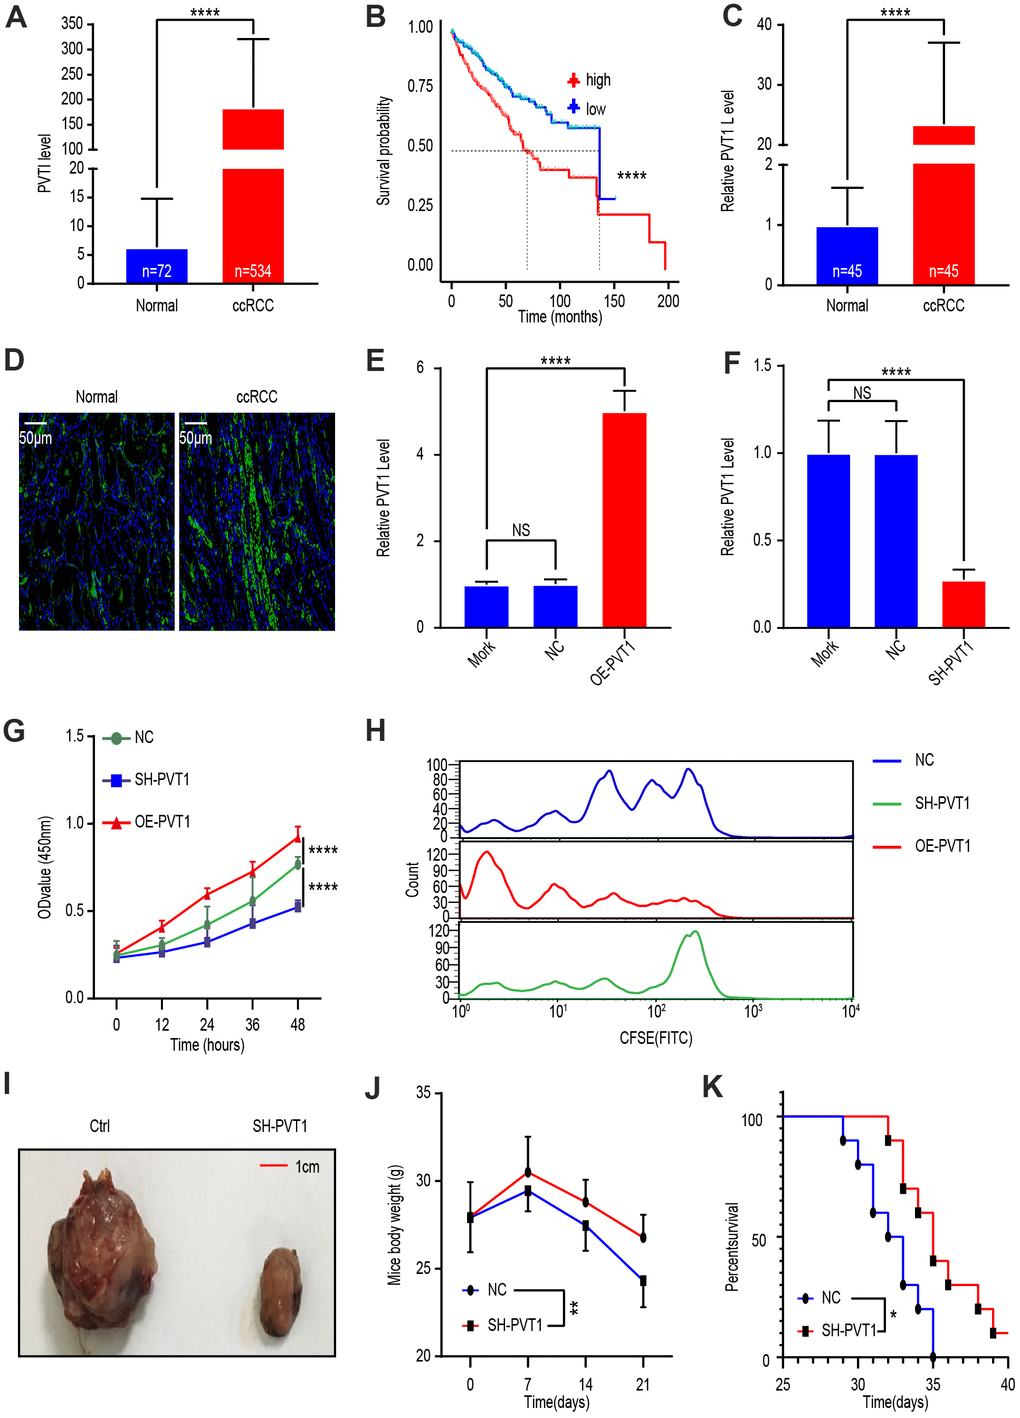
Figure 1.LncRNA PVT1 is upregulated in ccRCC tissues and promotes cancer cell proliferation. (A) PVT1 expression level in ccRCC compared with that in normal renal tissues according to TCGA database. (B) Survival time of ccRCC patients with high or low PVT1 levels according to TCGA database. (C) PVT1 levels in ccRCC tissues and adjacent normal renal tissues were determined by qRT-PCR. (D) Representative images of fluorescently labeled PVT1 in ccRCC tissues and adjacent normal renal tissues. (E) PVT1 expression in Caki-1 cells treated with Mork, Lentivirus vector, or oe-PVT1 Lentivirus, determined by qRT-PCR. (F) PVT1 expression in Caki-1 cells treated with Mork, Lentivirus vector or sh-PVT1 Lentivirus, determined by qRT-PCR. (G) Cell viability was determined by CCK-8 assays after Lentivirus vector, sh-PVT1 Lentivirus, or oe-PVT1 Lentivirus treatment. (H) Fluorescence attenuation in CFSE-labeled-Caki-1 cells after lentivirus vector, SH-PVT1 Lentivirus, or OE-PVT1 lentivirus treatment for 48 hours. (I) Tumor shape and size of ccRCC xenograft mouse models harboring tumors generated by cells treated with lentivirus vector or OE-PVT1 lentivirus. (J) Body weight of xenograft models harboring tumor generated by cells treated with Lentivirus vector or sh-PVT1 Lentivirus. (K) Survival time of xenograft models harboring tumors generated by cells treated with lentivirus vector or SH-PVT1 lentivirus. Mean ± SEM, *P < 0.05, **P < 0.01, ****P < 0.001, NS: no significance.