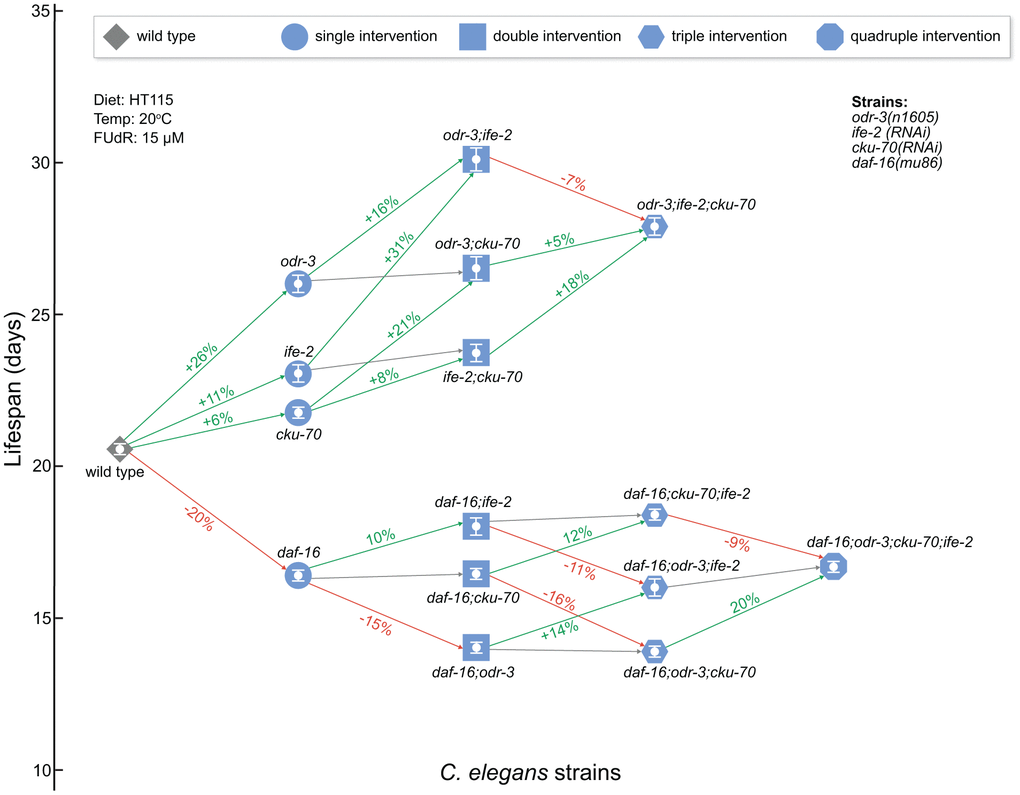
Figure 2.Network schematic representation of the strains analyzed in this study and of the effects of each genetic intervention. Nodes represent the strains as follows: diamond for WT, circle for single gene interventions, square for double gene interventions, hexagon for triple gene interventions, and octagon for quadruple gene interventions. Nodes are positioned on the vertical axis according to their respective mean lifespan. Edges between worm strains are colored depending on the gain (or loss) in lifespan extension: increase (green), decrease (red) and small or non-significant change (gray). The extent of the change is included on the edge as a percentage increase/decrease between the origin and destination nodes of the edge. odr-3 and daf-16 denote mutants containing the odr-3(n1605) and daf-16(mu86) mutations; ife-2 and cku-70 denote animals in which these genes were modulated by RNAi bacteria. The white bars inside of the nodes indicate the mean ± SEM.