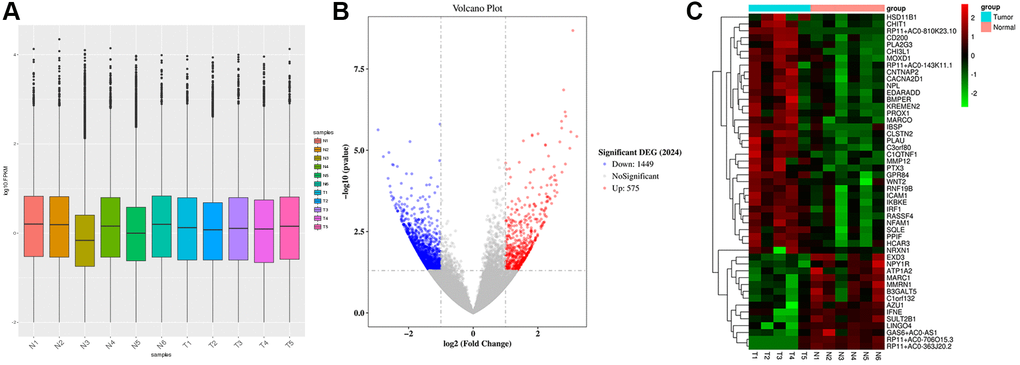
Figure 1.Raw data preprocessing and DEGs screening. (A) The distribution of gene expression levels in the samples was relatively uniform. (B) A total of 2024 DEGs were obtained between Normal group (N, n = 6) and Tumor group (T, n = 5). 1449 DEGs were down-regulated, and 575 DEGs were up-regulated. (C) Heatmap shows the DEGs.