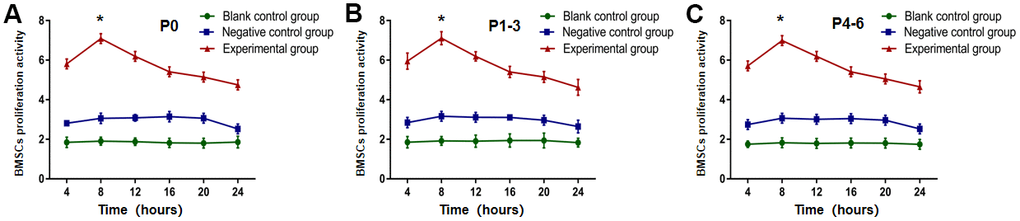
Figure 3.OD value from P0-6 BMSCs in experimental group was highest at eight hours after E16 transplantation using the CCK-8 test. The OD value from (A) P0, (B) P1-3 and (C) P4-6 in experimental group was the highest at eight hours after E16 transplantation, and then gradually decreased (P<0.05). * P <0.05 versus blank control group + negative control group.