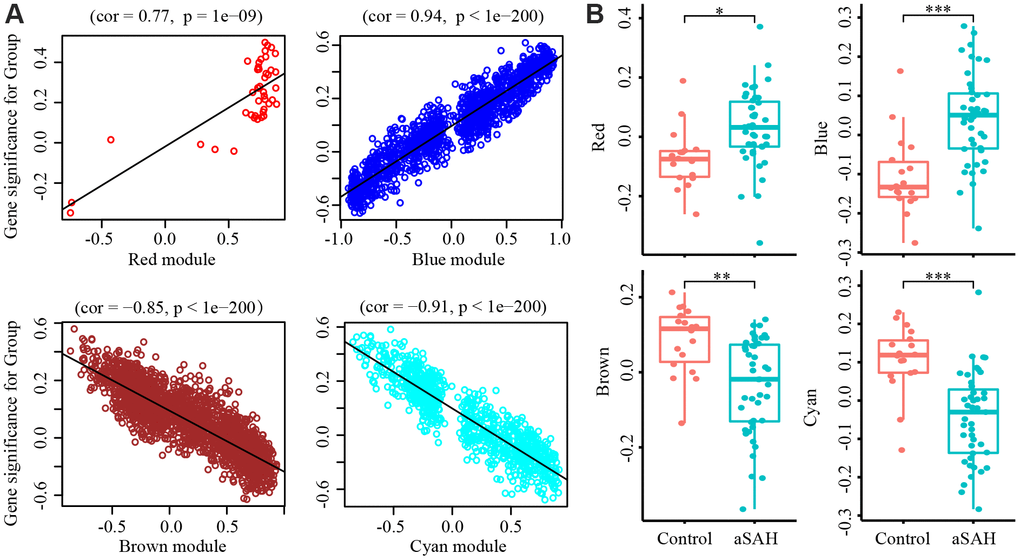
Figure 3.Gene Significance (GS) and module membership (MM) were calculated with Pearson correlation analysis. (A) The GS and MM are highly correlated in red (cor = 0.77, P = 1e-09), blue (cor = 0.94, P = 1e-200), brown (cor = -0.85, P = 1e-200) and cyan (cor = -0.91, P = 1e-200) module, indicated that the red and blue module contain genes that have high positive correlation with aSAH while the brown and cyan module contain genes that high negative correlations with aSAH. (B) The GS of aSAH group in red (*: p < 0.01) and blue (***: P < 0.0001) module were significantly higher than control group, while the opposite result was shown in the brown (**: P < 0.001) and cyan module (***: P < 0.0001).