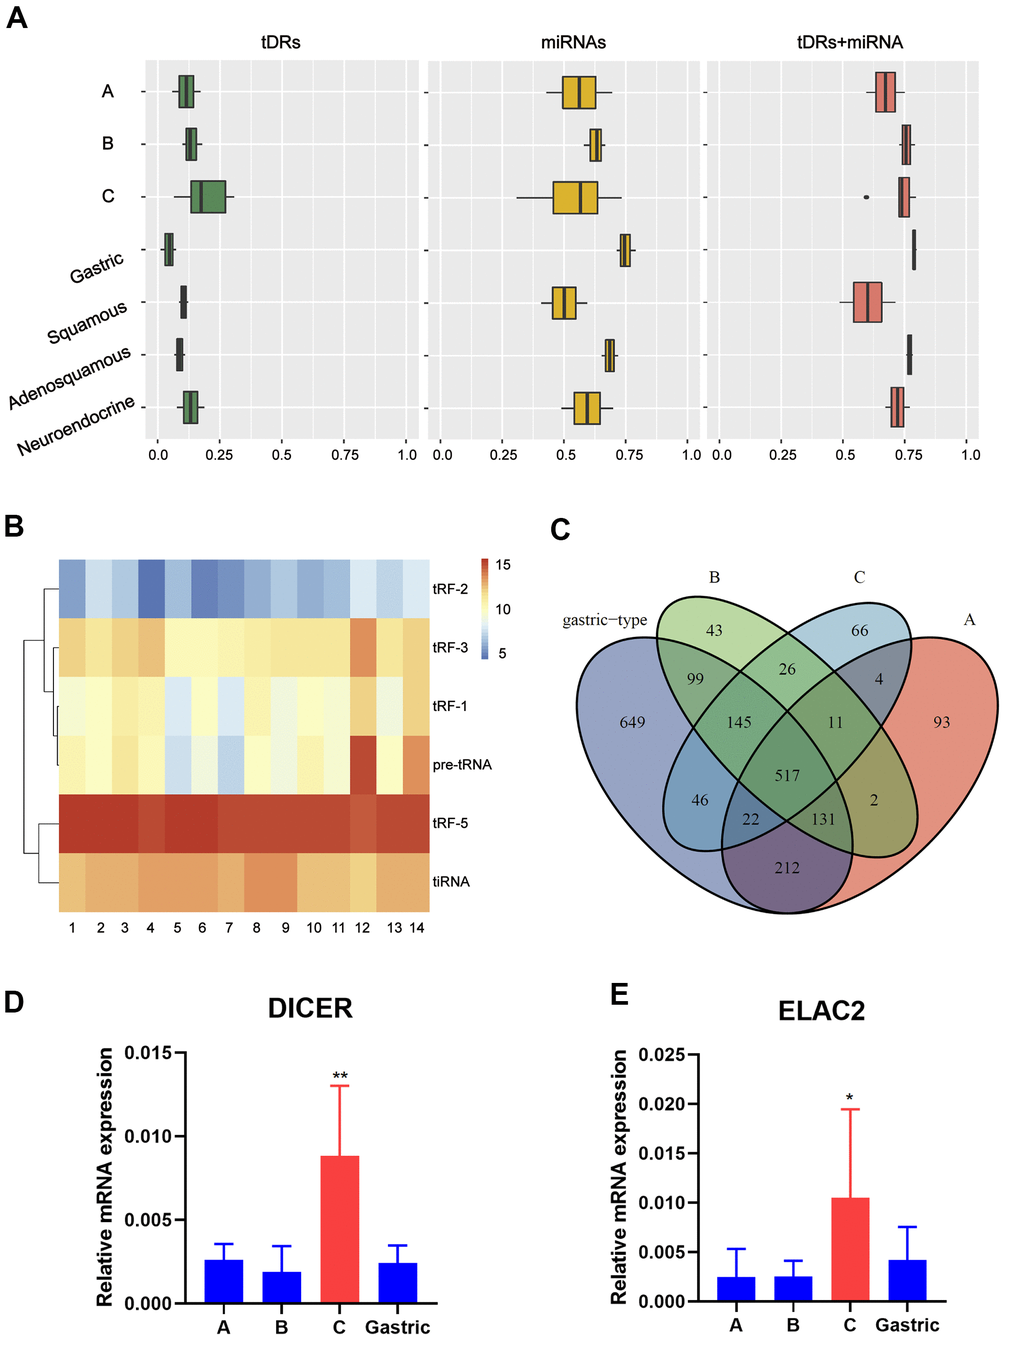
Figure 1.Catalog of small RNA profiles in different subtypes of EAC. (A) Distribution of RNA Biotypes Differs between Biofluids. Reads mapping to miRNAs, tRNAs or other RNA biotypes as a fraction of total reads mapping to the human transcriptome. Boxes represent median and interquartile ranges, whiskers represent 1.5 times the interquartile range, and dots represent outliers. (B) Heatmap depicting all subtypes of tDRs of each sample. (C) Venn plot shows that EAC of A, B, C and Gastric type have great differences in the distribution of tDRs types based on the anticodon of amino acids. (D, E) RT-PCR analysis shows a significant increase of Dicer1 and ELAC2 expression in pattern C compared with pattern A/B/Gastric. (Student t test, *P <0.05).