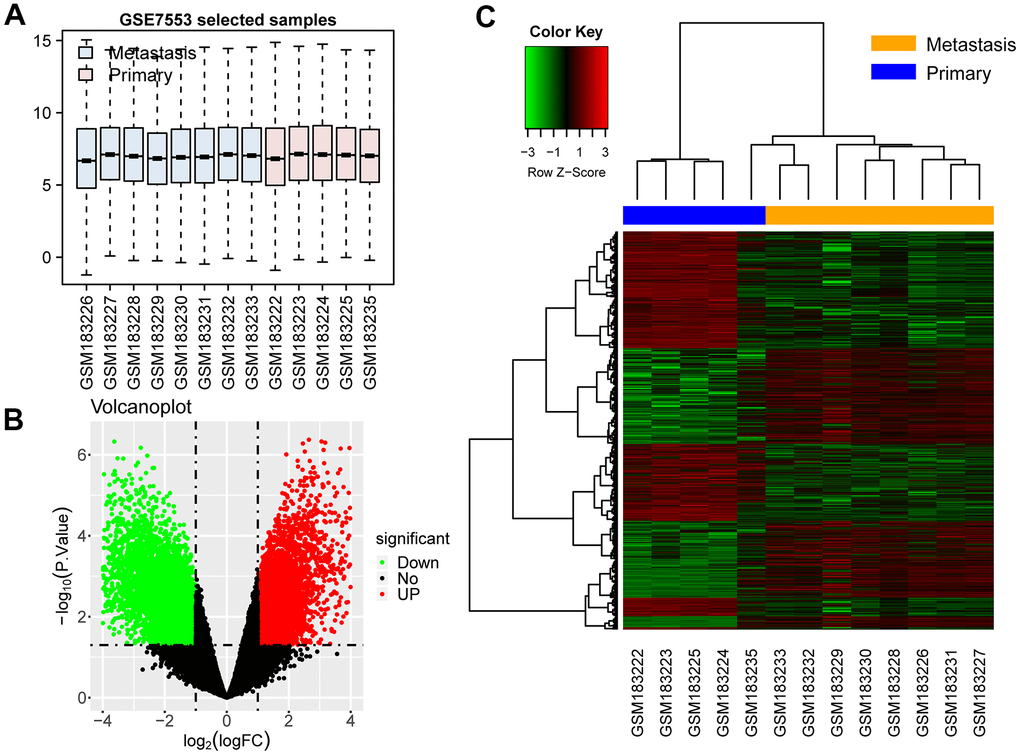
Figure 1.DEGs in the two groups of samples. (A) Box plot: Expression levels of all samples are normalized. (B) Volcano map of DEGs: the green dots represent downregulated genes in metastases, and the red ones represent upregulated genes. (C) Cluster heat map: the green blocks represent downregulated genes in metastases. The red blocks represent upregulated genes.