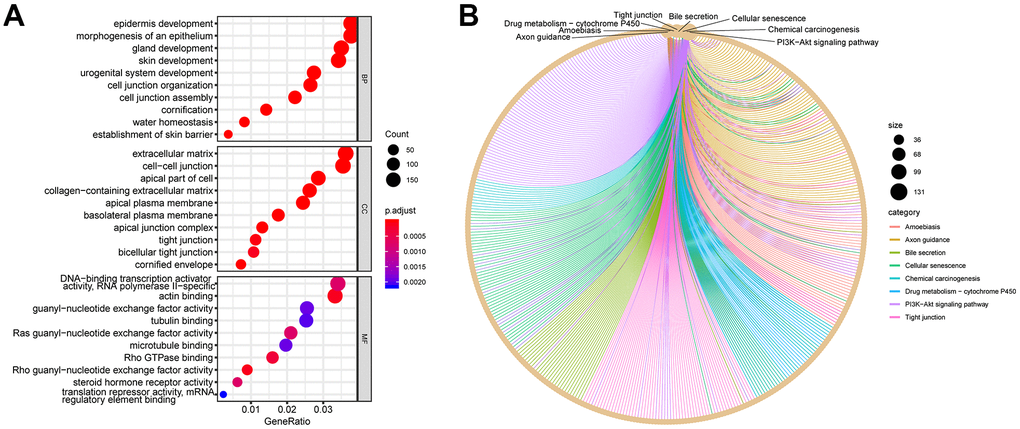
Figure 2.GO and KEGG plots calculated using DEGs. (A) GO dot plot: top 10 items in each category. (B) KEGG network plot: top eight pathway items calculated using DEGs. The surrounding dots represent genes.
Figure 2 — Identification of genes and pathways leading to metastasis and poor prognosis in melanoma | Aging