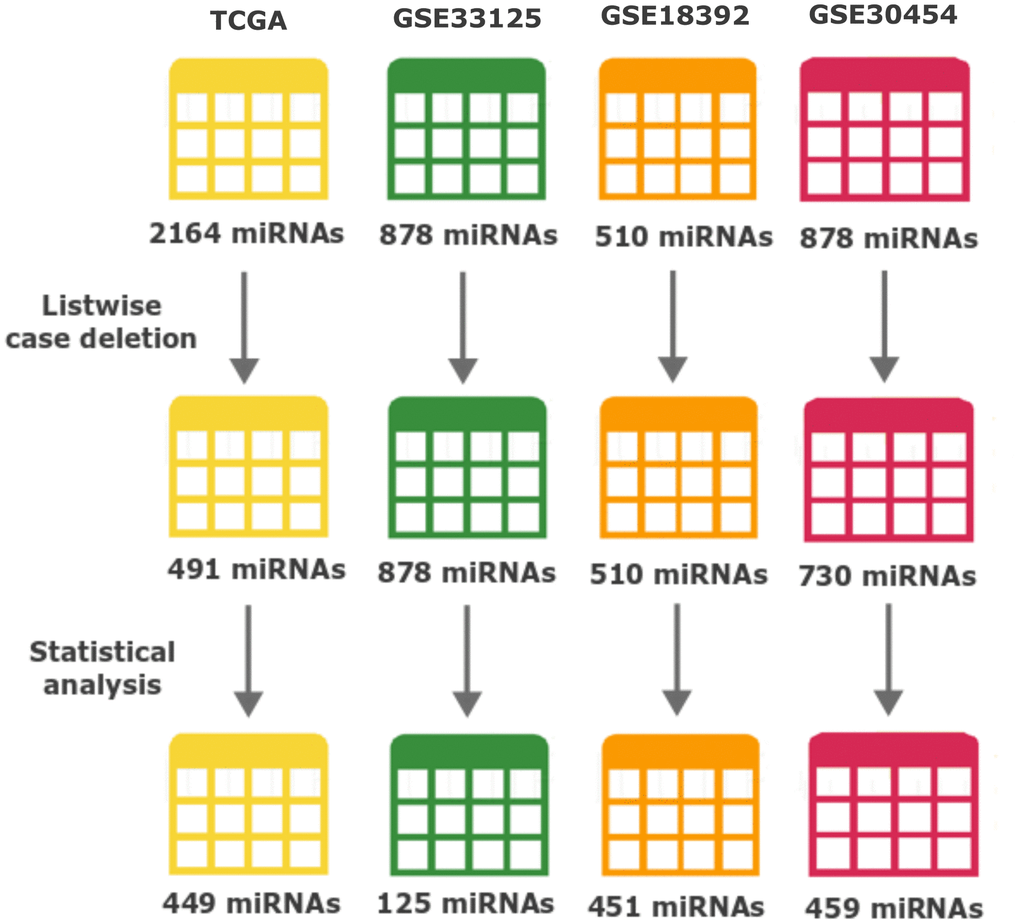
Figure 1.Number of miRNAs throughout data processing and statistical analysis. The number of miRNAs after each major event (Listwise case deletion and Statistical analysis) is shown below each dataset. Different colours represent: yellow TCGA, green GSE33215, orange GSE18392 and reddish-purple GSE30454. From the top, the numbers of miRNAs represent: the initially number of miRNAs present in each dataset before any processing step; the number of miRNAs after removing the ones with more than 50% information missing (modified listwise case deletion); and the number of miRNAs after performing all the statistics and used to perform the identification of differently expressed miRNAs across datasets.