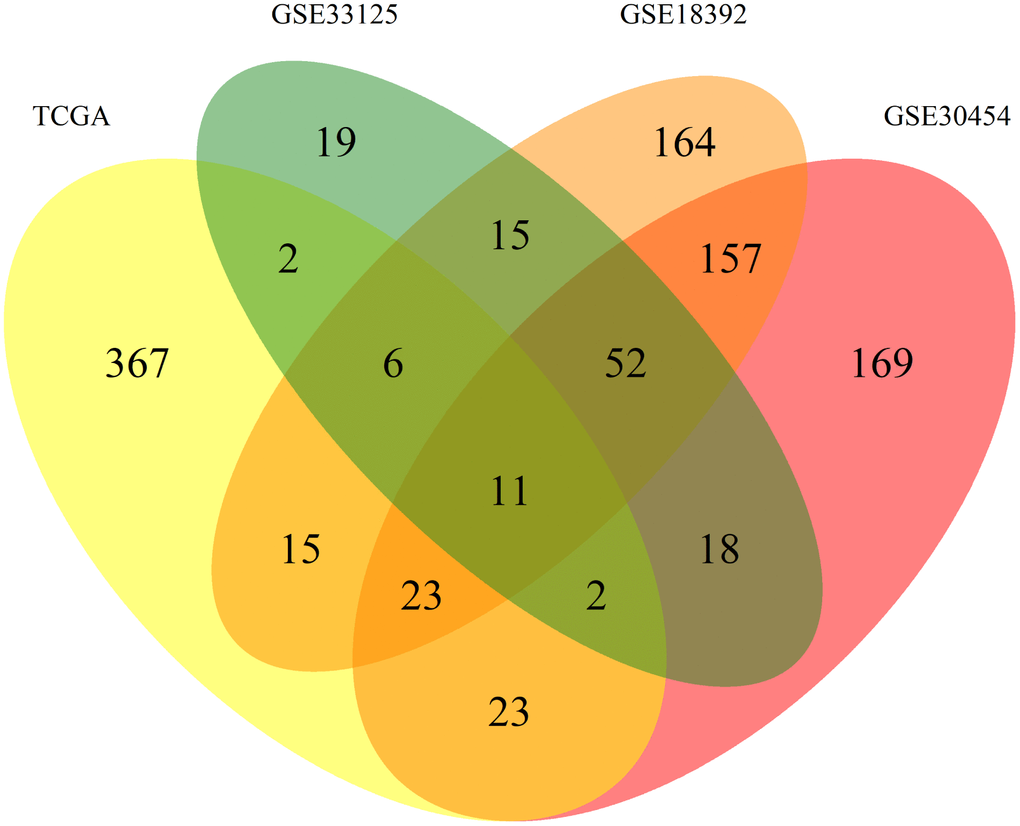
Figure 2.Venn diagram of the differently expressed miRNAs between datasets. Allocation of the 1043 differently expressed miRNAs found between the 4 datasets used in this work. Each dataset is represented by a colour, TCGA (yellow), GSE30545 (reddish purple), GSE33215 (green) and GSE18392 (orange). The number in each overlay of datasets represents the common miRNAs between those datasets.