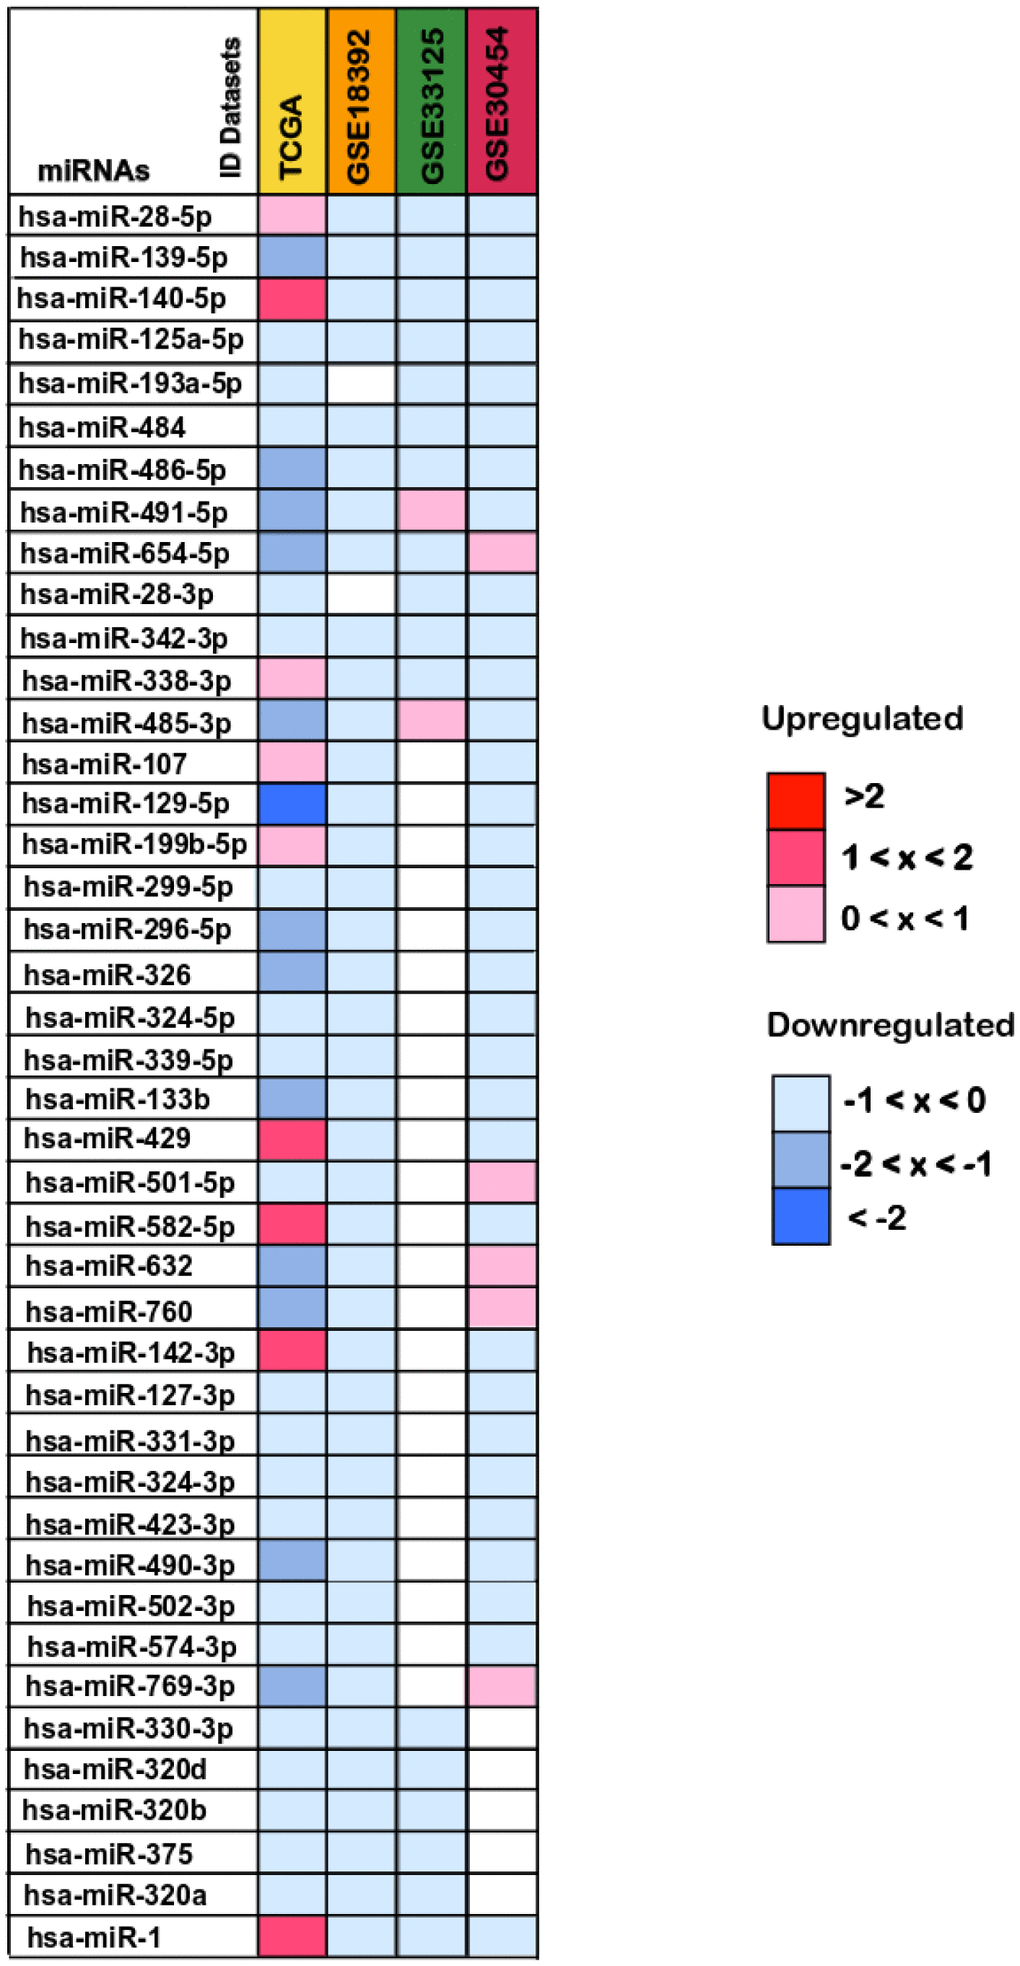
Figure 3.Differentially expressed miRNAs between colorectal cancer and normal tissue samples. The log2(FC) values calculated for each dataset are reported with red scale boxes for upregulated miRNAs and blue scale boxes for the downregulated miRNAs. White boxes represent the inexistence of the miRNA on the dataset. Only the miRNAs differentially expressed in at least 2 datasets while simultaneously being present in the TCGA dataset are displayed.