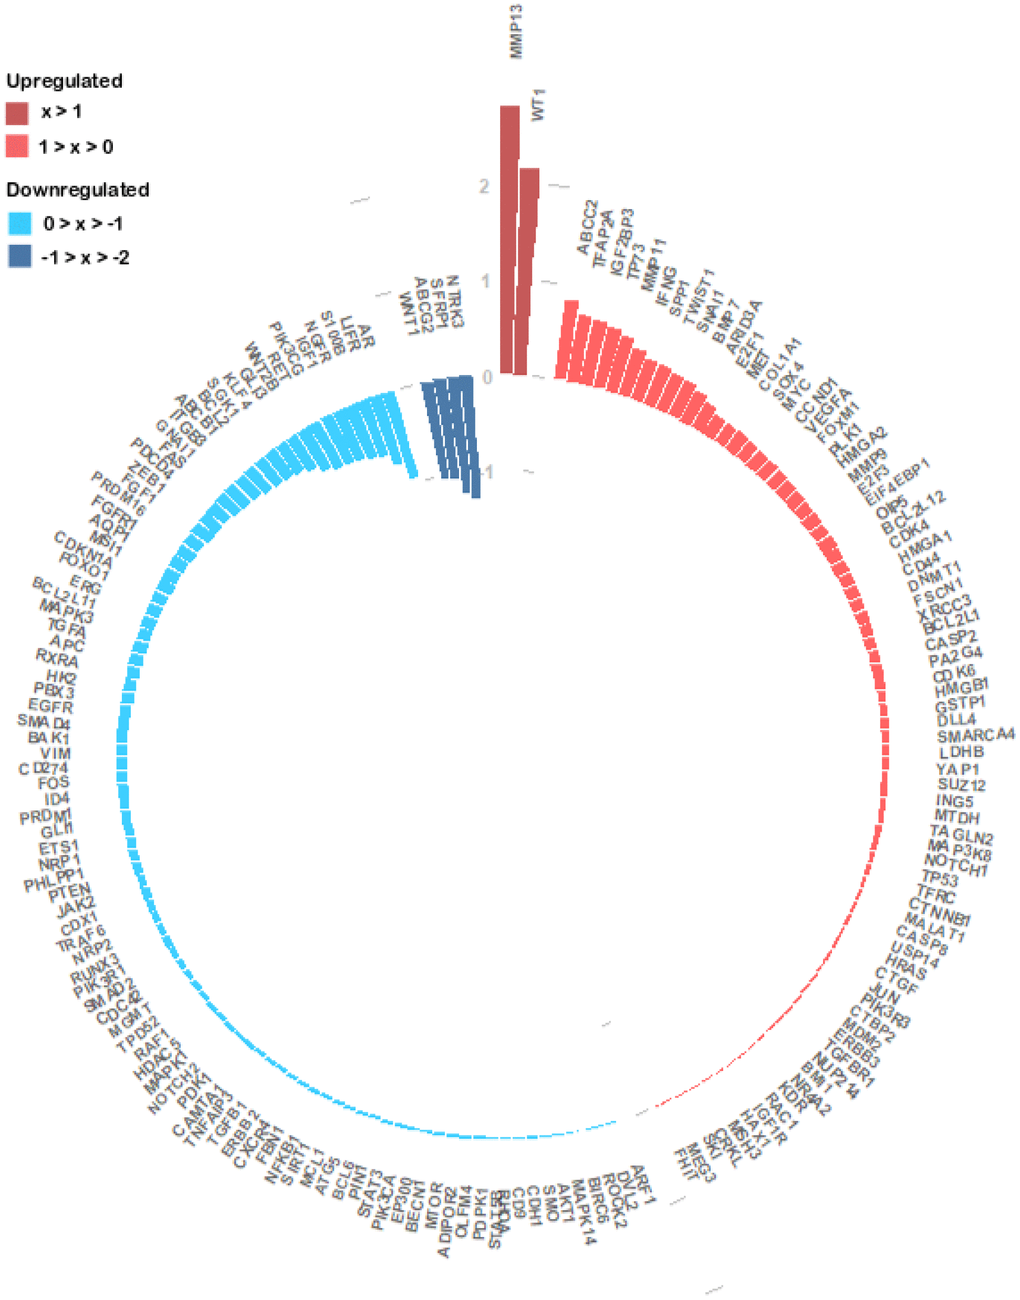
Figure 5.Circular barplot evidencing the expression of the 172 experimentally validated miRNA target genes. The expression values of the 172 genes were obtained from the TCGA colon and rectal cohorts and the log2(FC) values between the primary tumour and normal tissue samples were calculated. The log2(FC) value of each gene is given by the length and tone of each coloured bar in accordance with each gene regulation status (red colours – upregulated; blue colours- downregulated).