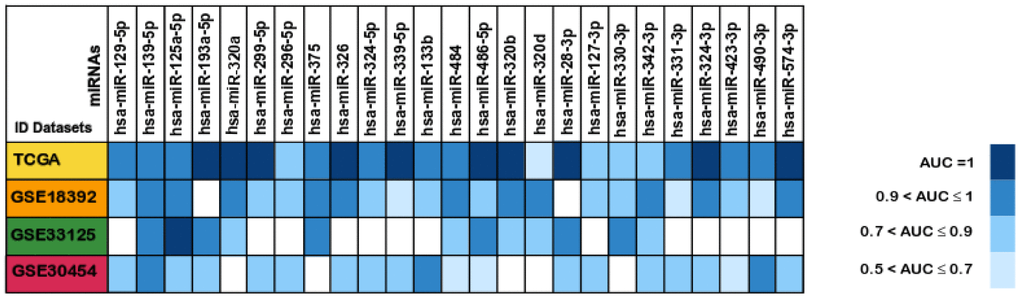
Figure 7.Areas under the ROC curve (AUC) of the 25 differentially expressed miRNAs between colorectal cancer and normal tissues samples. The miRNAs AUC values in each of the datasets TCGA (Yellow), GSE18392 (orange), GSE33125 (Green) and GSE30454 (reddish purple) are reported as blue scale boxes. MiRNAs with AUC = 1 were considered perfect diagnostic biomarkers, 0.9 < AUC < 1 highly accurate, 0.7 < AUC ≤ 0.9 moderately accurate and 0.5 < AUC ≤ 0.7 less accurate [76].
Figure 7 — Identification of colorectal cancer associated biomarkers: an integrated analysis of miRNA expression | Aging