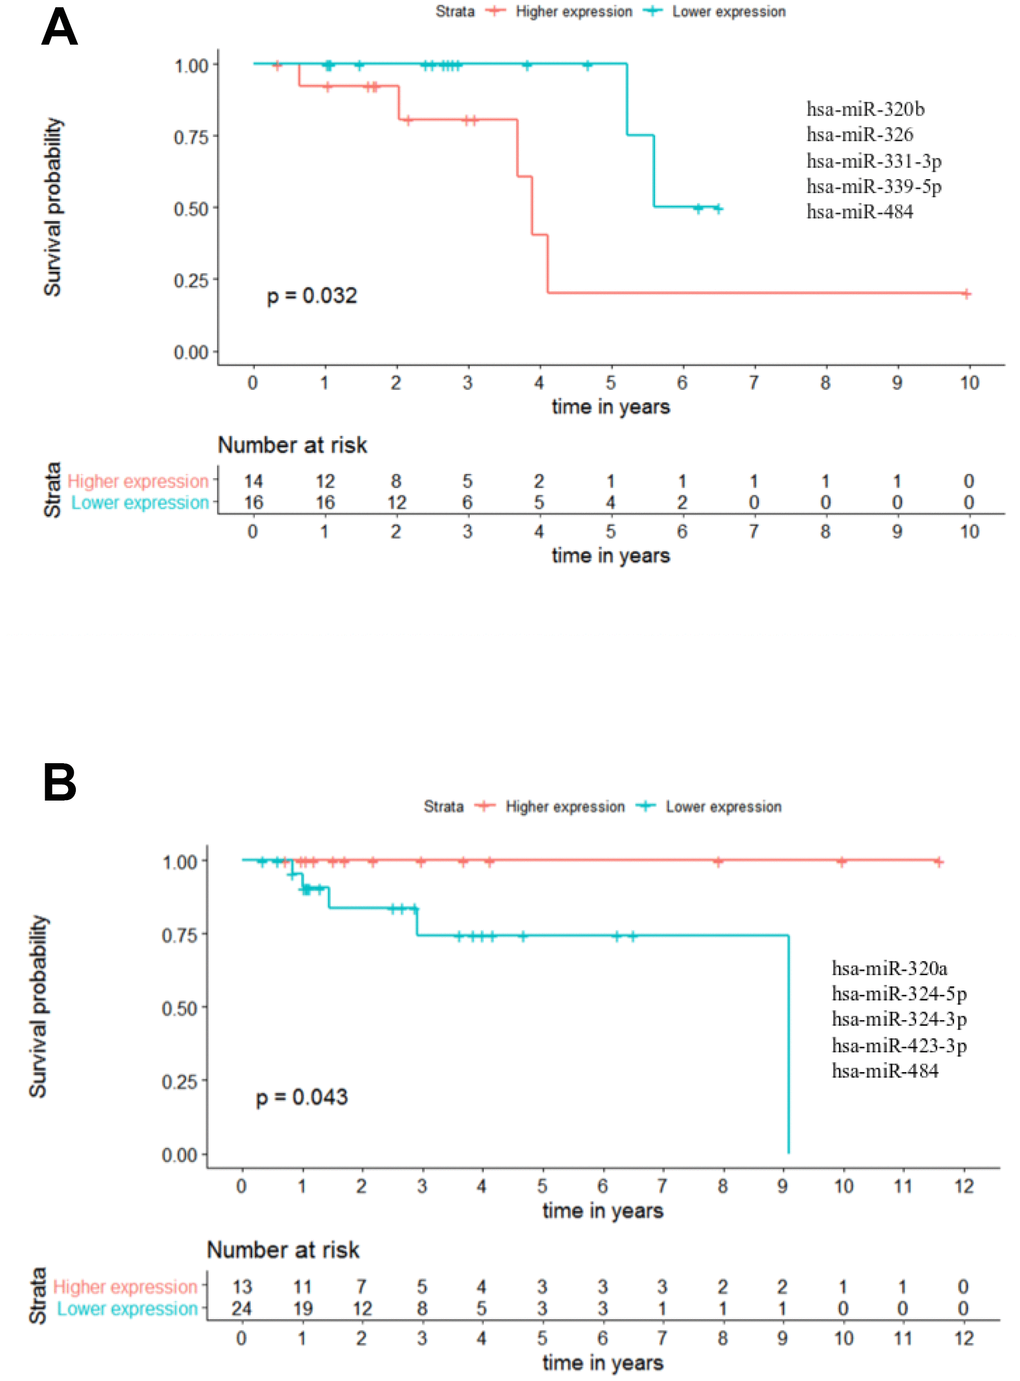
Figure 9.Panels of 5 miRNAs for overall survival (OS) and recurrence free survival (RFS) prognosis of stage II patients. (A) Stage II OS Kaplan-Meier curve based on miR-320b - miR-326 - miR-331-3p - miR-339-5p - miR-484 (p-value = 0.032, Log rank test; HR= 5.23) (B) Stage II recurrence free survival RFS Kaplan-Meier curve based on miR-320a - miR-324-5p - miR-324-3p - miR-423-3p - miR-484 (p-value = 0.043, Log rank test). Time is represented in years. Higher (in red) and Lower (in blue) expression groups represent the group of patients with miRNA expression above and below miRNAs median expression, respectively. Censored data is represented by small plus signs in each group. The number of patients at risk for each group and per time point is shown in the table below each graph. HR, hazard ratio.