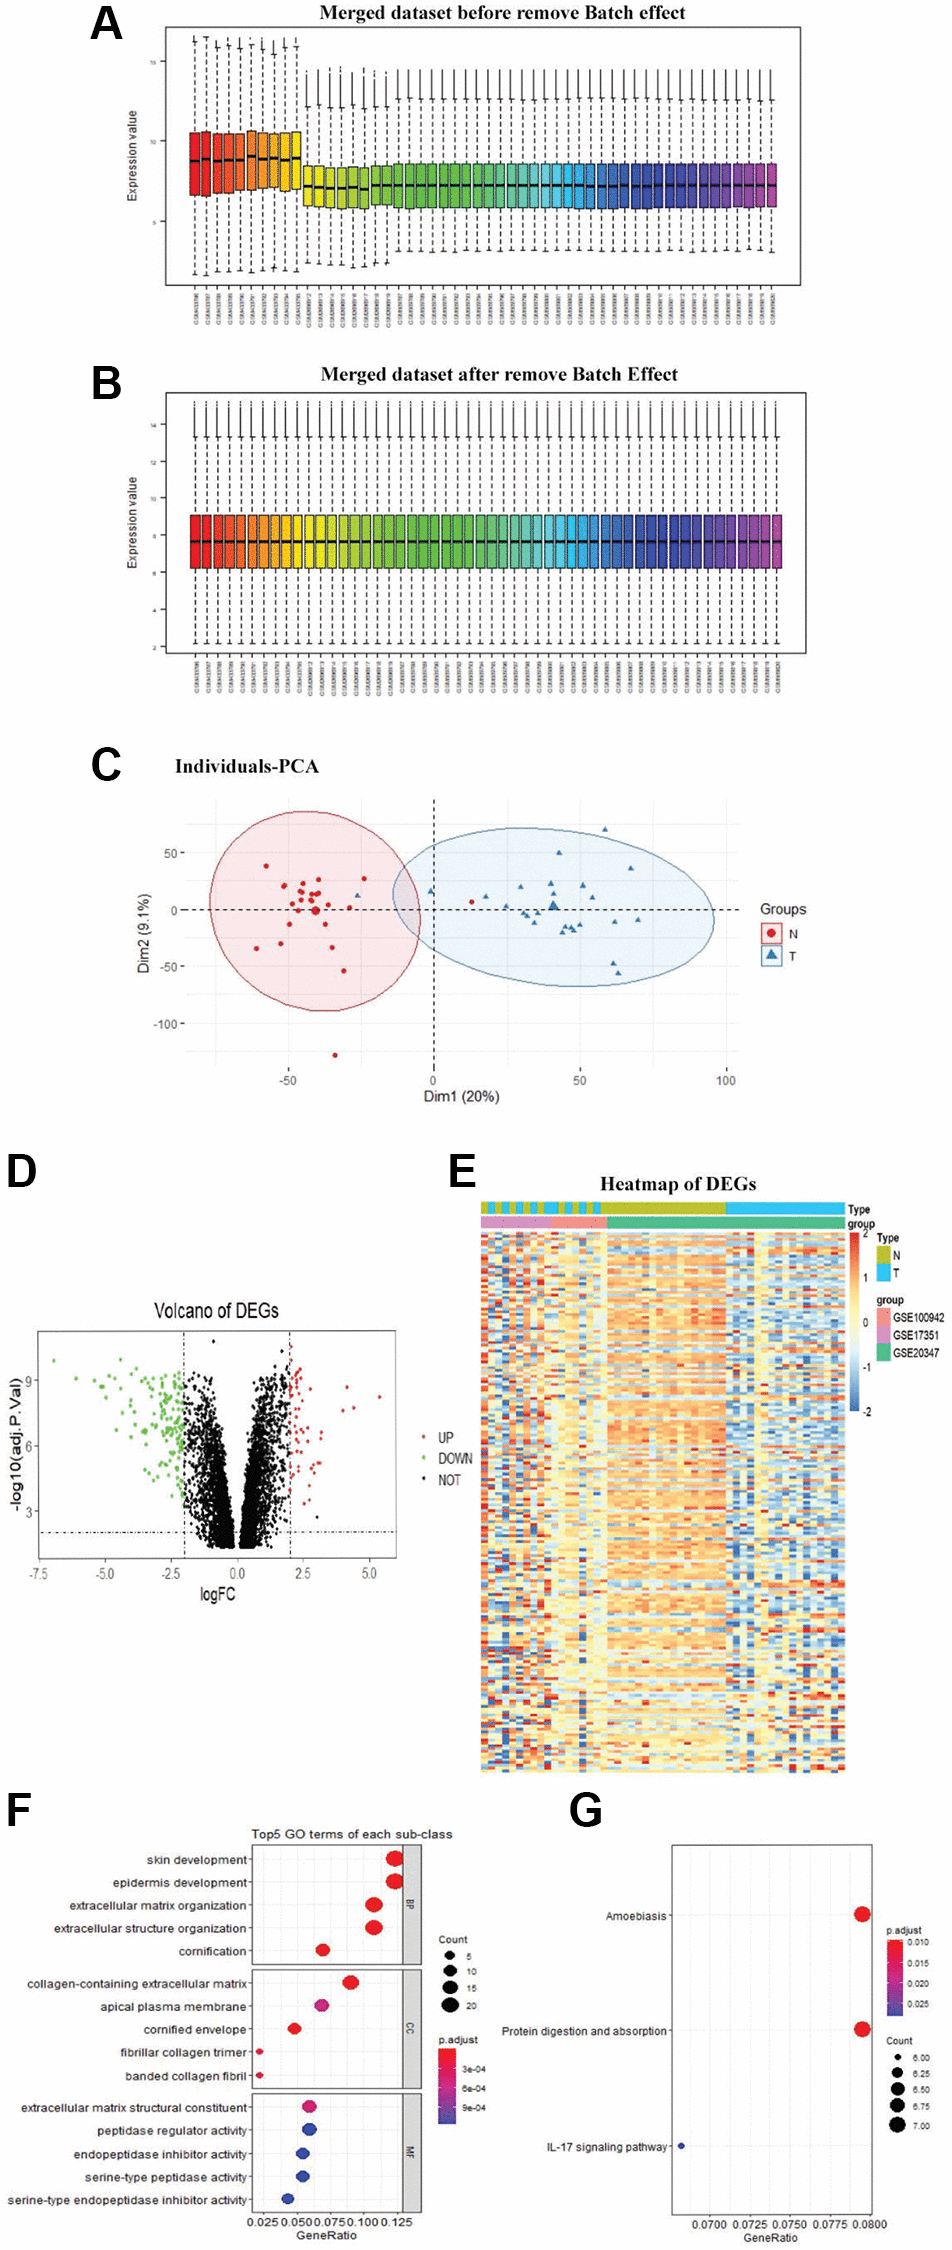
Figure 1.Identification of DEGs. The merged dataset before removed the batch effect (A). The merged dataset after removed the batch effect (B). PCA was done for the merged dataset for dimensionality reduction and quality control (C). Volcano plot of DEGs, the red dots represent the upregulated genes and the green dots represent the downregulated genes based on an adjusted P-value < 0.001 and | logFC | ≥ 2, the black spots represent genes with no significant difference in expression (D). Heatmap of DEGs, red representing high relative expression, and blue representing low relative expression (E). DEGs with the top 5 enriched GO terms (F) of each subclass and KEGG (G) pathway enrichment analyses of DEGs (P < 0.05)