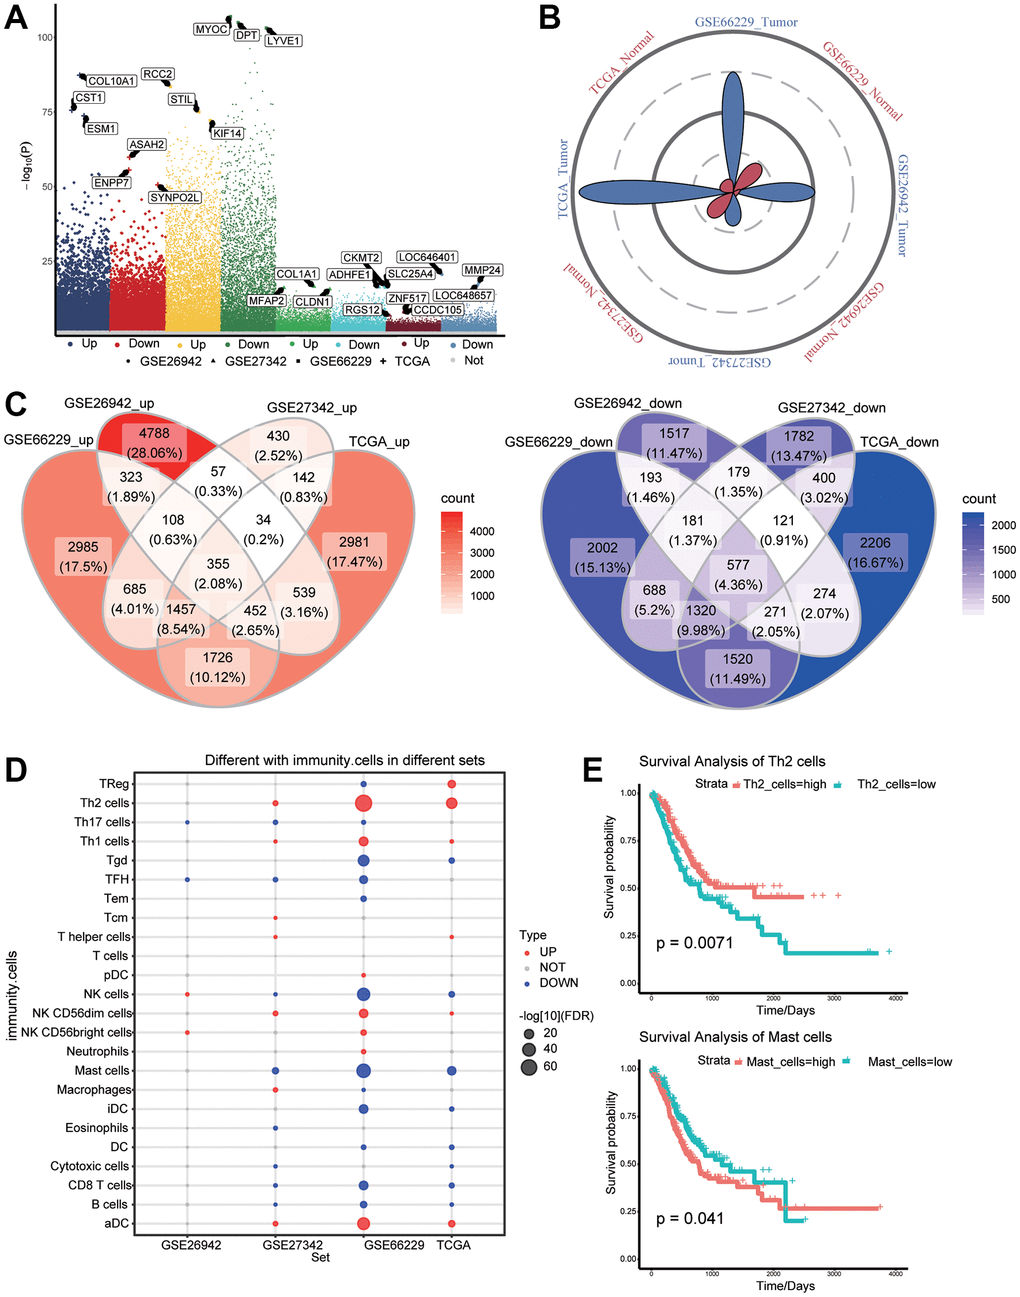
Figure 2.Differentially expressed genes (DEGs) and immune cell infiltration in gastric cancer and normal tissues. (A) DEGs between gastric cancer and normal tissues in The Cancer Genome Atlas (TCGA) as well as GSE26942, GSE27342, and GSE66229 datasets. (B) Petal plots of sample size for four sets of gastric cancer-related data. (C) Overexpressed (left panel) and under expressed (right panel) genes considered as DEGs in the TCGA data. (D) Differential infiltration of immune cells between gastric cancer and normal tissues. (E) Kaplan–Meier curves showed that immune cell infiltration was related to overall survival of gastric cancer patients.