


Introduction
Gastric cancer (GC) is the third leading cause of cancer-related deaths and the fifth most common type of malignancy worldwide [1]. About 50% of GC cases occur in East Asia, and it is the most common gastrointestinal malignancy in China [2]. Poor dietary habits, history of Helicobacter pylori infection, genetic factors, pre-malignant gastric lesions, and smoking have been identified as risk factors for gastric cancer [3]. Unfortunately, early gastric cancer diagnosis is not feasible in the majority of patients. As a result, most gastric cancers are diagnosed at advanced stages, and 25–50% of patients develop metastases during the course of the disease [4].
To date, the main treatment for gastric cancer includes surgical excision plus standard D2 lymph node dissection [5]. Currently, no chemotherapy or molecular therapy, alone or in combination with other treatments, consistently leads to an objective, lasting tumor response. Gastric cancer immunotherapy is another potentially effective therapeutic approach [6]. Although chemotherapy regimens have improved progression-free survival and overall survival in patients with advanced gastric cancer, their median survival tends to be less than one year [7]. The incidence of gastric cancer has decreased over the past decades, but the five-year survival rate remains only around 10% for patients with advanced disease [8]. Therefore, understanding the mechanism of disease progression and finding new and effective prognostic factors and targets for intervention are of great significance for improving long-term survival.
Gastric cancer is characterized by hypoxia and immunosuppression, thereby hindering the ability of the immune system to fight cancer [9]. Inflammatory mediators and cytokines play a crucial role in the formation of the tumor microenvironment, further stimulating tumor development [10].
In recent years, the application of high-throughput technologies has led to a new understanding of the molecular pathogenesis of GC, and potential markers and therapeutic targets can be explored based on the genomic characteristics of tumors [11]. In recent studies, many oncogenes or suppressor genes associated with GC have been reported [12, 13]. The protein “leucine rich repeat and fibronectin type III domain containing 4” (LRFN4) is expressed in a variety of cancers and leukemia cells [14]. LRFN4 signaling plays an important role in monocyte/macrophage migration [15]. Dermatopontin (DPT) can promote the formation of collagen fibers and improve the biological activity of TGF-β [16, 17]. The expression level of DPT may be closely related to the pathogenesis of cancer [18].
In the present study, we took gene expression data in GC from The Cancer Genome Atlas (TCGA) and Gene Omnibus (GEO) databases in order to search for prognostic genes and immune cells associated with GC development. To further explore dysregulated molecular mechanisms in GC, we performed enrichment analysis. Potential prognostic genes were evaluated using nomograms and risk scores. The effects of key genes on the survival of gastric cancer patients were validated by hierarchical clustering. These results may provide a new reference for predicting and understanding the prognosis of patients with gastric cancer.
Materials and Methods
Data sources
We collected gastric cancer data from TCGA and GEO databases (GSE26942, GSE27342, and GSE66229). GSE26942 included gene expression profiling data from 205 gastric tumor tissues and 12 surrounding normal gastric tissues. Gene expression data were normalized by quantile normalization and log2 transformation. GSE27342 included gene expression profiling data of paired tumor and adjacent normal tissues from 80 gastric cancer patients. The raw probe intensities were normalized using the quartile normalization approach, and the probe signal was summarized to the level of gene expression using the pathway-level information extractor (PLIER) method [19]. GSE66229 included gene expression profiles from 300 gastric tumors and 100 normal controls. Raw expression data were normalized and summarized using the robust multichip analysis (RMA) method [20] along with log2 transformation. TCGA included RNAseq gene expression data of 373 cases of primary lung adenocarcinoma and 32 cases of normal samples. Count data were normalized using the DESeq2 package in R [21].
Differentially expressed gene (DEG) analysis
DEGs between GC and controls in GEO datasets were identified using the limma package in R [22]. DEGs in the TCGA dataset were obtained using DESeq2. DEGs were defined as genes showing a > xx-fold difference with a P-value < 0.05.
Co-expression analysis
Weighted gene coexpression network analysis (WGCNA) [23] was used to construct the gene coexpression network for DEGs. The soft-thresholding power we chose was used as the correlation coefficient threshold. The parameters were set as follows: minModuleSize = 30, verbose = 3, and mergeCutHeight = 0.25. Then, we built the minimum number of genes in gene modules. Module-trait correlation analysis was performed based on Pearson correlation.
Enrichment analysis
Enrichment analysis of Gene Ontology (GO) terms and Kyoto Encyclopedia of Genes and Genomes (KEGG) pathways was performed for gene modules using the clusterProfile package in R [24]. GO terms included biological processes, cellular components, and molecular functions. ClusterProfiler was also used to conduct gene set enrichment analysis (GSEA) [25]. P value < 0.05 was chosen as the cut-off criterion for enrichment. Gene set variation analysis (GSVA) with KEGG pathways was performed using the GSVA Bioconductor package [26]. Activated or inhibited states of signaling pathways were calculated using limma.
Single-sample GSEA
We obtained a set of marker genes for immune cell types from a previous publication [27]. The infiltration level of each immune cell type was calculated by single-sample GSEA using the GSVA tool in R. We calculated differences in immune cell infiltration between gastric cancer and control samples. Hierarchical cluster analysis was used to group tumors with different patterns of immune cell infiltration with the same invasion direction and significance for patients' survival.
STEM analysis
First, we used the STEM algorithm and software (v1.3.11) to organize genes into distinct clusters based on expression patterns [28]. To filter out gene sets that were significantly correlated with the time series, the gene count in each cluster was set to >30, and the correlation coefficient of gene expression in each cluster was set to >0.8. All significant gene sets were associated with P < 0.05, and all showed similar expression trends.
Identification of CpG sites and somatic mutation of GC
Infinium HumanMethylation450 BeadChip data of the GC and normal tissue samples were obtained from TCGA. The chAMP package [29] in R was used to identify differences in methylation between the GC and normal in TCGA. The β value of methylation was calculated for all CpG probes (sites) with a detection P value ≤ 0.05. DNA methylation level at each site was calculated based on the methylation signal intensity (M) and non-methylation signal intensity (U). Somatic mutations in GC samples in TCGA were identified using maftools [30].
Prediction of gene prognostic value
Kaplan-Meier estimator and log-rank tests were performed using the functions surv, survfit, and survdiff in R. Multivariate Cox regression analyses were used to test the independent prognostic value of the genes using the survival package and coxph function in R. Areas under the receiver operating characteristic curve (AUCs) were calculated for those genes using the pROC package [31].
Data availability
The datasets presented in this study can be found in TCGA and GEO databases (accession numbers GSE26942, GSE27342, and GSE66229).
Results
Differential expression analysis of gastric cancer and normal tissue samples
The flowchart of the study is shown in Figure 1. According to the screening criteria of DEGs, we obtained 14375 DEGs in TCGA data, 9969 DEGs in GSE26942, 8516 DEGs in GSE27342, and 14843 DEGs in GSE66229, all with P-values <0.05 (Figure 2A). The sample sizes of TCGA and GSE66229 were relatively large (Figure 2B). In these two datasets, 9,188 common DEGs (either up- or downregulated) were identified (Figure 2C).
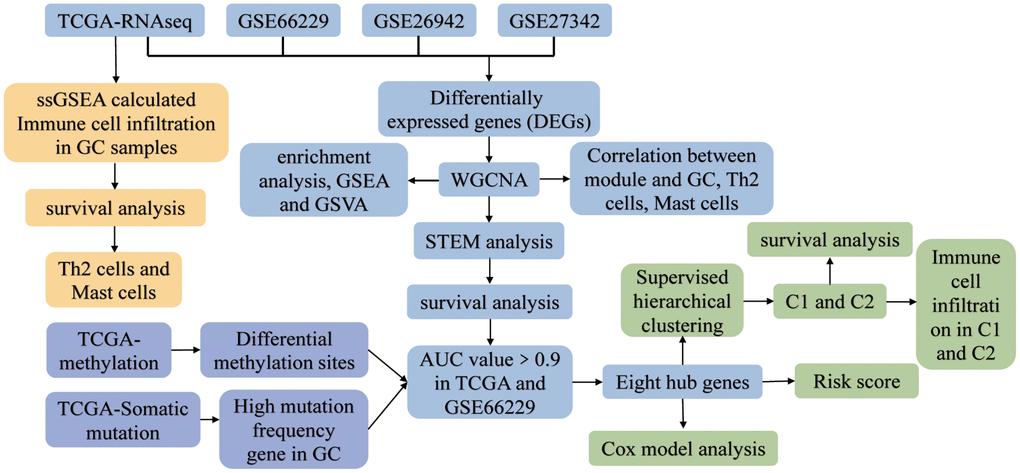
Figure 1. The study flowchart. Abbreviations: AUC: area under the receiver operating characteristic curve; C1: cluster 1; C2: cluster 2; GC: gastric cancer; GSEA: gene set enrichment analysis; GSVA: gene set variation analysis; ssGSEA: single-sample gene set enrichment analysis; STEM: short time-series expression miner; TCGA: The Cancer Genome Atlas; WGCNA: weighted gene co-expression network analysis.
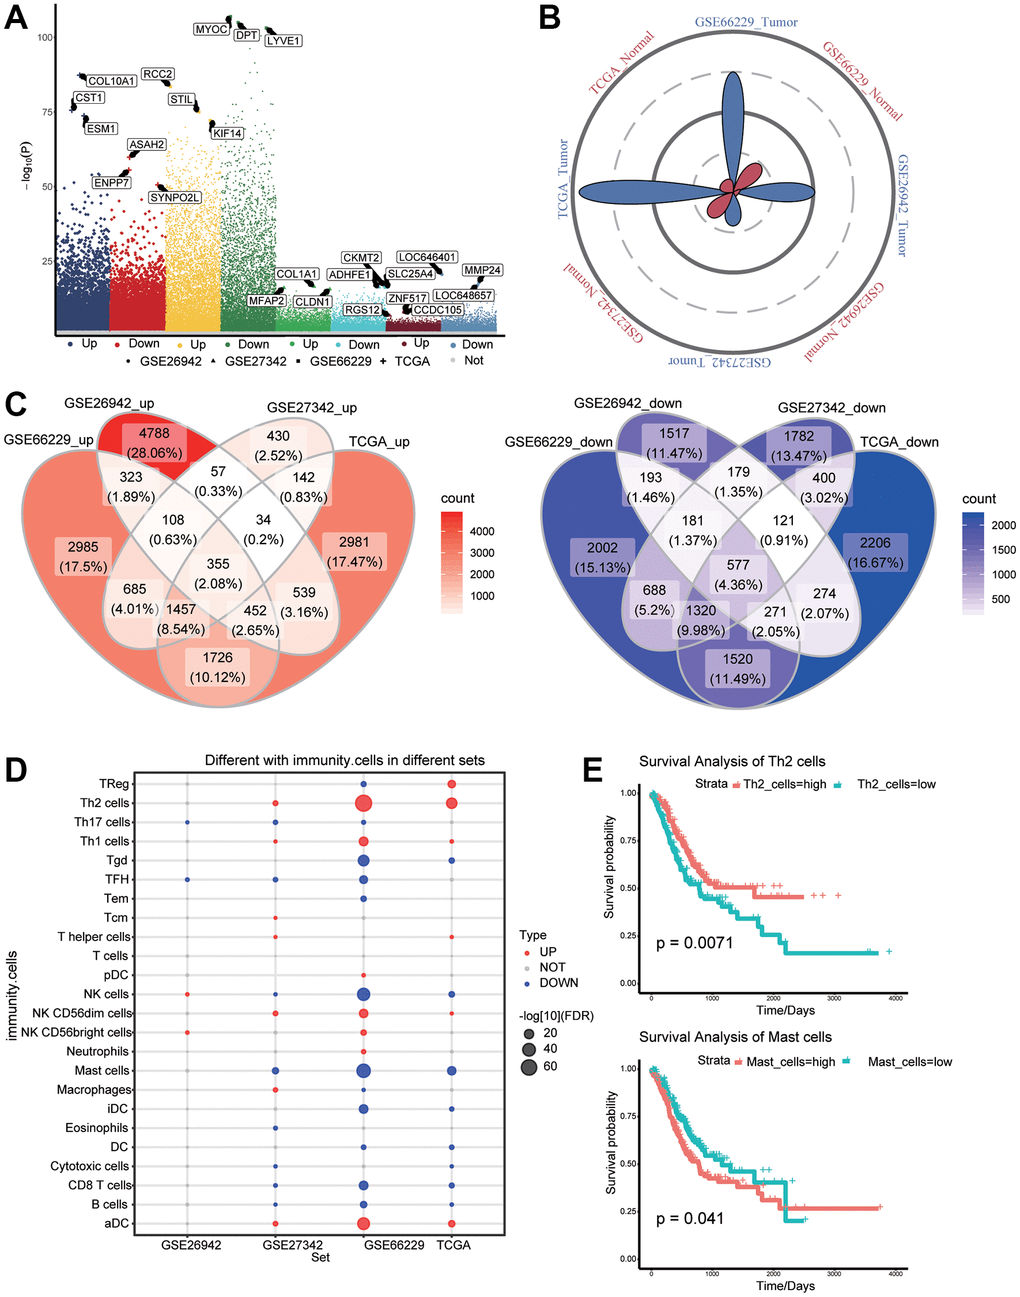
Figure 2. Differentially expressed genes (DEGs) and immune cell infiltration in gastric cancer and normal tissues. (A) DEGs between gastric cancer and normal tissues in The Cancer Genome Atlas (TCGA) as well as GSE26942, GSE27342, and GSE66229 datasets. (B) Petal plots of sample size for four sets of gastric cancer-related data. (C) Overexpressed (left panel) and under expressed (right panel) genes considered as DEGs in the TCGA data. (D) Differential infiltration of immune cells between gastric cancer and normal tissues. (E) Kaplan–Meier curves showed that immune cell infiltration was related to overall survival of gastric cancer patients.
Immune cell infiltration
To identify the potential role of immune cells in gastric cancer, we analyzed differences in immune cell infiltration between tumors and normal tissues (Figure 2D). Among the differentially infiltrated immune cells, Th2 and mast cells affected the overall survival of gastric cancer patients (Figure 2E).
Construction of coexpression networks for DEGs
Common genes with | log2(fold change) | >0.5 were further screened to construct the coexpression network. β = 6 was chosen as the soft threshold power to construct a scale-free network (Figure 3A). We identified a total of 13 modules containing 4440 genes (Figure 3B). By correlating the expression of genes in modules to different stages of gastric cancer, we identified up- or downregulated modules (Figure 3C). Furthermore, the relationship between the modules and the clinical traits was evaluated to identify hub modules (Figure 3D). Significant correlations were found between modules and gastric cancer, as well as immune cells. Notably, the module named as 'blue' had the highest negative correlation with tumors and Th2 cells, but the highest positive correlation with normal and mast cells. The correlation between the brown module and traits was the opposite.
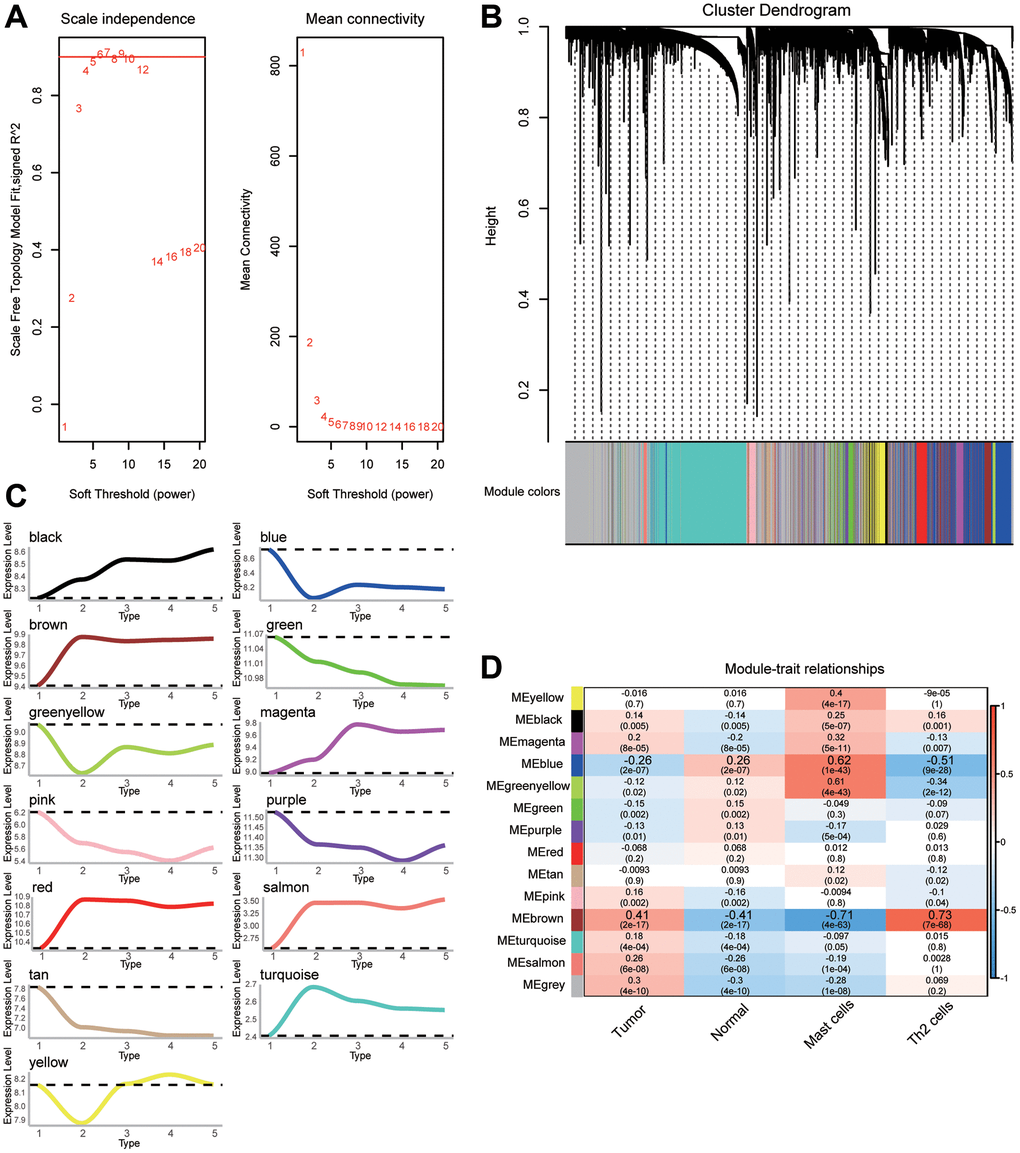
Figure 3. The weighted gene coexpression network analysis (WGCNA) network for selected genes. (A) Analysis of the scale-free fit index and the mean connectivity for various soft-thresholding powers (β). (B) Cluster dendrogram of differentially expressed genes (DEGs) showing similar expression trends. (C) Up- or downregulation trend of gene modules. (D) Heatmap of the correlation between gene modules and clinical traits.
Biological functions of module genes
Performing enrichment analysis of module genes, we identified GO functions and KEGG signaling pathways associated with gastric cancer. Among the 1003 biological processes with P-value < 0.05, we found that “regulatory T cell differentiation”, “type I interferon signaling pathway”, “response to interleukin-21”, “inhibition of hepatic immune response”, “apoptotic nuclear changes”, and “activation of MAPK activity” were enriched (Figure 4A) Among the 116 KEGG pathways enriched for module genes, pathways involving PI3K-Akt, JAK-STAT, and Toll-like receptor (TLR) were activated, while pathways involving Th1 and Th2 cell differentiation, apoptosis, and tumor necrosis factor (TNF) were inhibited (Figure 4B). GSEA identified activation of the cell cycle and inhibition of gastric acid secretion in GC (Figure 4C).
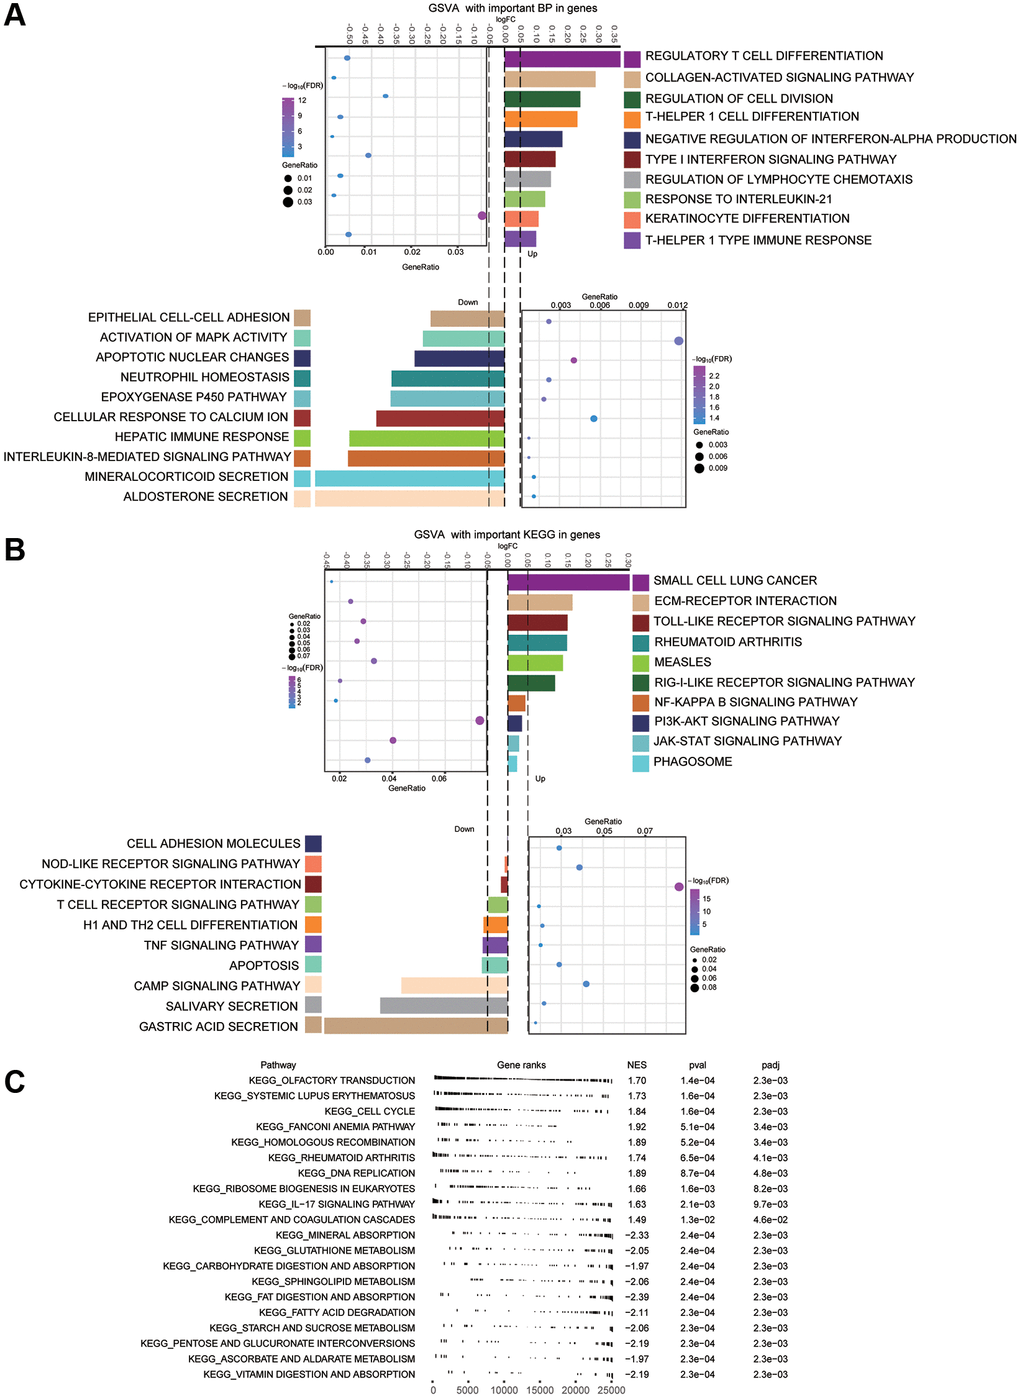
Figure 4. Main enrichment results of module genes. (A) Main biological processes (BPs) of module genes. (B) Kyoto Encyclopedia of Genes and Genomes (KEGG) pathway analysis for module genes. (C) Gene set enrichment analysis (GSEA) terms of up- and down-regulated genes. The first 10 terms corresponded to up-regulated genes, and the last 10 terms to down-regulated ones.
Persistently dysregulated genes in the development of gastric cancer
Clustering of module genes by STEM software according to the development of gastric cancer revealed 10 groups of clusters with different dynamic gene expression patterns (Figure 5A and 5B). We found 1381 genes that exhibited consistently up- or downregulated expression patterns during the development of gastric cancer. SubtypeGSEA showed that TLR signaling pathway, mRNA surveillance pathway, and rheumatoid arthritis pathway were consistently activated with the development of gastric cancer, while histidine metabolism, alpha linolenic acid metabolism, and peroxisomes were consistently inhibited (Figure 5C and 5D).
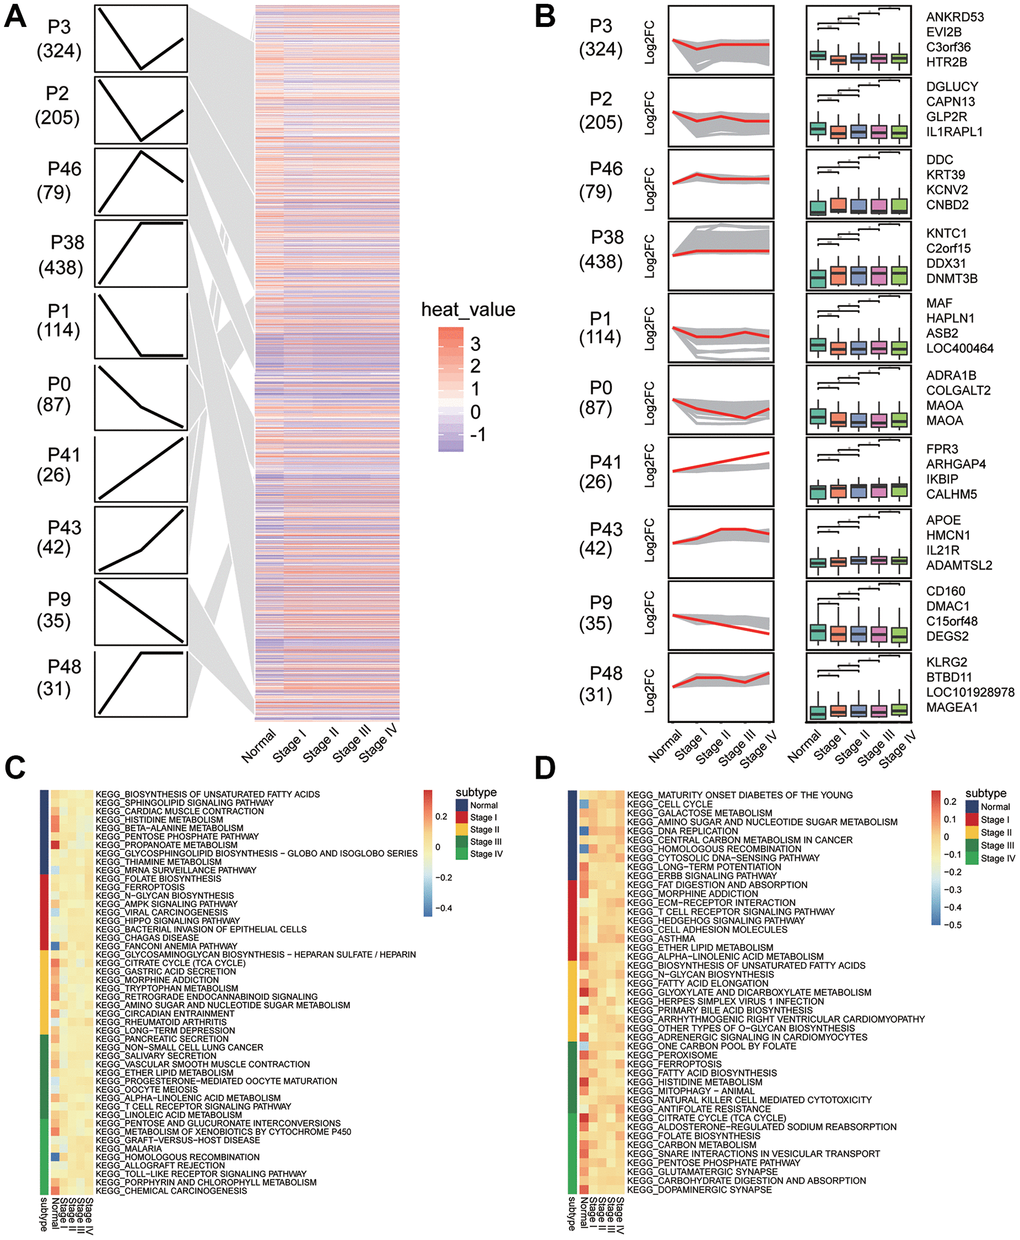
Figure 5. Sets of genes showing persistent up- or down-regulation during gastric cancer development. (A) Heatmap of gene sets with persistent under- or overexpression from normal to stage IV of gastric cancer. (B) The top four genes with the greatest fold-change in transcription level in 10 clusters. (C) Signaling pathways that are consistently up-regulated as tumors develop. (D) Signaling pathways that are consistently down-regulated as tumors develop.
Key genes associated with gastric cancer progression
Principal component analysis found that the TCGA and GSE66229 data showed the greatest separation between tumor and normal samples (Supplementary Figure 1). We selected survival-related genes with AUCs greater than 0.9 as key genes (Figure 6A). Compared with normal tissues, ADAM12, CEP55, LRFN4, and INHBA were up-regulated in gastric cancer samples, while ADH1B, DPT, FAM107A, and LOC100506388 were downregulated. In addition, our correlation analysis showed that key gene expression was significantly associated with age and overall survival of GC patients (Figure 6B). Interestingly, ADH1B, DPT, FAM107A, and LOC100506388 belonged to the blue module, whereas CEP55 and LRFN4 belonged to the brown module.
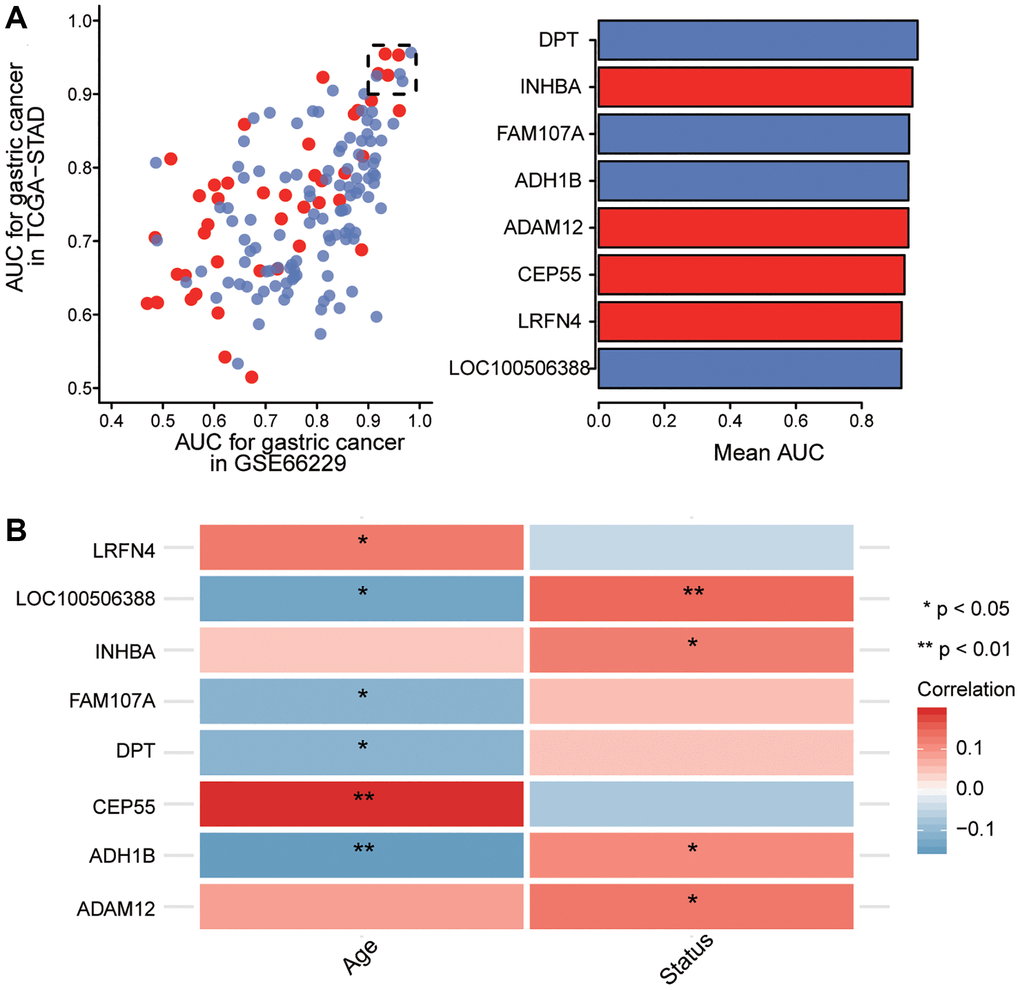
Figure 6. Screening of key genes. (A) Identification of key genes with areas under the receiving operating characteristic curve (AUCs) greater than 0.9 in The Cancer Genome Atlas (TCGA) and GSE66229. Red indicates up-regulated expression and blue, down-regulated. (B) Correlation of key gene expression with age and overall survival of gastric cancer patients in the TCGA dataset. Red indicates a positive correlation and blue, a negative correlation. *P < 0.05, **P < 0.01.
Prognostic model of key genes
Survival information of gastric cancer patients was analyzed using a Cox regression survival nomogram (Figure 7A). The results showed that elevated expression of DPT and LRFN4 predicted good prognosis, while overexpression of LOC100506388 was associated with poor prognosis. The calibration curve showed that the nomogram performed well compared to an ideal model (Figure 7B).
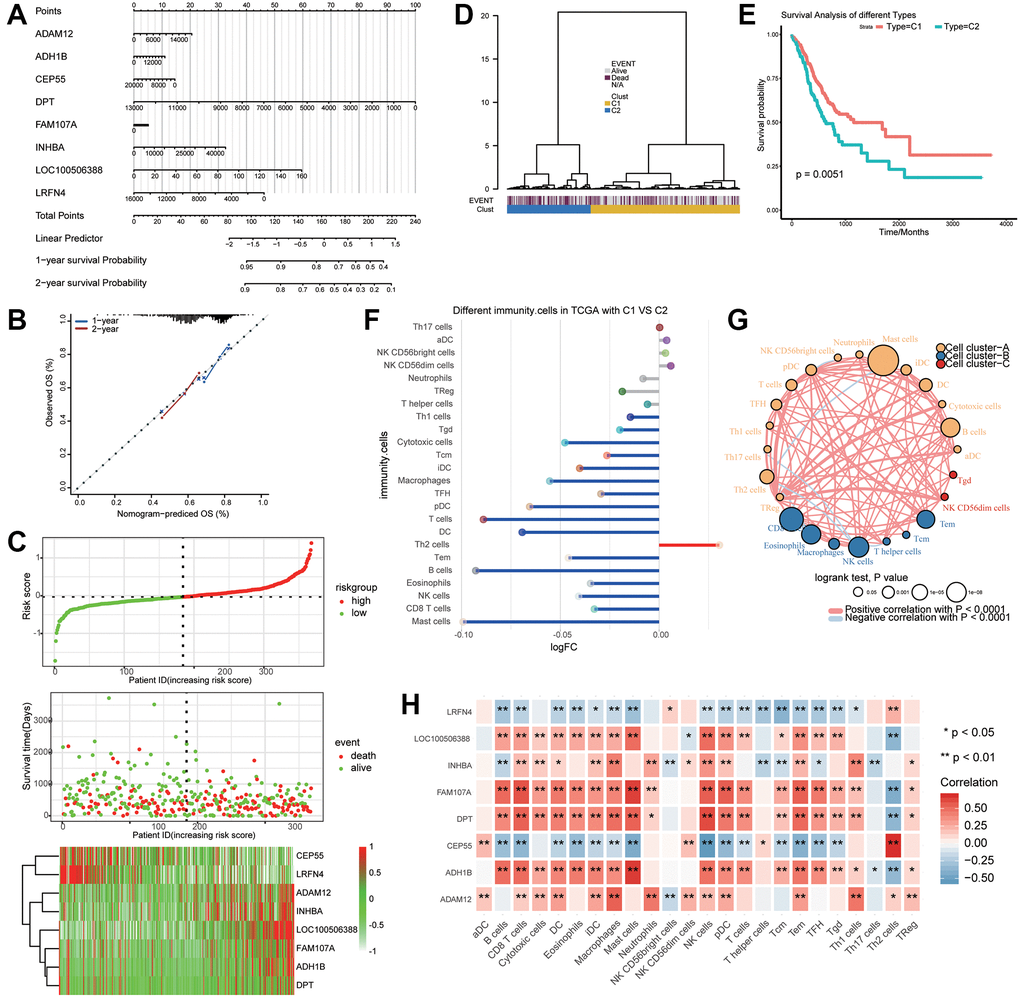
Figure 7. Key genes associated with the prognosis of gastric cancer patients. (A) The nomogram predicting overall survival in gastric cancer patients. (B) Plots depicting the calibration of the model in terms of agreement between predicted and observed one- and two-year outcomes. (C) Distribution of risk score, overall survival, and heatmap of the key genes in The Cancer Genome Atlas (TCGA) dataset. (D) Dendrogram of key genes in the TCGA dataset distinguished survival status by supervised hierarchical clustering. (E) Two clusters were associated with overall survival. (F) Differences in immune cell infiltration between clusters 1 (C1) and 2 (C2). (G) Correlation and clustering for immune cells. (H) Correlation between the expression of key genes and immune cell infiltration.
Risk scores were calculated based on the expression of key genes, and the median risk score was used to classify patients into high- or low-risk groups. The results showed that ADAM12, INHBA, LOC100506388, FAM107A, and ADH1B were upregulated in the high-risk group, while CEP55 and LRFN4 were highly expressed in the low-risk group (Figure 7C).
Supervised hierarchical clustering of key genes that discriminated the prognosis of gastric cancer patients generated two clusters (Figure 7D) that were associated with overall survival (Figure 7E). Compared with cluster 2, cluster 1 gene expression in gastric cancer patients correlated with good prognosis. Interestingly, Th2 cells were upregulated in cluster 1, whereas mast cells were downregulated (Figure 7F). These immune cells clustered into three categories, with a significant negative correlation between Th2 cells and mast cells (Figure 7G). CEP55 expression was most positively associated with Th2 cells and negatively associated with mast cells (Figure 7H). FAM107A and ADH1B were positively associated with mast cells but negatively associated with Th2 cells.
Discussion
The identification of early diagnostic and prognostic markers has important diagnostic and therapeutic implications for patients with gastric cancer [32]. In this study, we searched relevant genes that may have an impact on the overall survival of gastric cancer patients by identifying those persistently dysregulated during tumor development. Then, we identified potential marker genes for the diagnosis and prognosis of gastric cancer. Importantly, based on the expression of key genes, high- and low-risk patients groups with different overall survival were established.
Our results showed that Th2 and mast cells were significantly infiltrated in gastric cancer patients. Strong infiltration by Th2 cells may be associated with early carcinogenesis and promote the activation of a tumor microenvironment that favors angiogenesis and metastasis [33]. Studies have shown that Th2 cell responses are associated with the development and progression of human gastric cancer [34]. Our analysis showed that infiltration by mast cells was lower in GC than in controls in all three datasets. This contrasts with reports that mast cell infiltration increases in gastric cancer tissues [35, 36]. This difference may be explained by the small sample size of normal tissues in our data. Survival analysis previously showed that mast cell infiltration was associated with worse prognosis in gastric cancer [37].
We screened DEGs with similar expression patterns by co-expression network analysis, and found significant correlations between them and gastric cancer or immune cells. The enrichment results of these genes showed that they were associated with immune inflammation and cancer-related biological functions. Recent studies have shown that T cell immunity may play an important role in the progression and prognosis of gastric cancer [38], including stage based on the “tumor, node and metastasis” system, depth of invasion, lymph node metastasis rate, and tumor immunity [39]. The proinflammatory cytokine interferon-β can exert antitumor activity by inhibiting angiogenesis, tumor growth, and metastasis [40]. The serum concentration of IL-21 in patients with gastric cancer is significantly higher than that in controls, so the cytokine may play some role in the development and progression of gastric cancer [41]. Activation of mitogen activated protein kinase (MAPK) p38 amplifies the inflammatory process, which in turn increases gastric cancer cell migration and invasion [42]. Inhibition of the JAK/STAT3 pathway in gastric tumor tissues reduces the inflammatory response, inhibits the inflammatory cytokines IL-1L, IL-6, and IL-1β, and decreases tumor volume [43]. In gastric cancer cells, activated PI3K/Akt signaling leads to NF-κB activation, which ultimately promotes cell migration and invasion [44]. TNF, a proinflammatory cytokine that can suppress some tumors when present at high concentrations, has attracted some attention as an anticancer therapy [45].
Given that gastric cancer is diagnosed at a late stage and has a poor prognosis, it is important to identify the molecular mechanisms and markers that influence its development. TLRs are recognized to be involved in different periods of gastric cancer progression and are gradually upregulated. Activation of TLR signaling pathways induces inflammatory cytokines and signaling pathways that play important roles in diseases such as cancer [46]. TLR2 is involved in the pathogenesis of gastric cancer, and high levels of TLR4 are also associated with a higher risk of this tumor type [47]. However, further studies are needed to determine the exact role of each TLR in the developmental mechanism of gastric cancer.
In the present work, comprehensive survival analysis and Cox regression analysis found that upregulation of DPT and LRFN4 correlated with good prognosis in gastric cancer patients. DPT is significantly downregulated in gastric cancer tissues [48], and it may contribute to oral cancer metastasis [49]. DPT is also involved in the inhibition of proliferation of keratinocytes, osteosarcoma cells, and papillary thyroid carcinoma cells in mice [50]. The expression of LRFN4 protein in cancer tissues is higher than in paracancerous tissues and benign gastric disease tissues [2]. Patients with high expression of LRFN4 had a higher survival rate than a low-expression group, and thus the potential protective role of LRFN4 in gastric cancer should be further explored [51]. Although we found no evidence that LOC100506388 affects prognosis in gastric cancer, our results suggest that expression of LOC100506388 may help to predict the disease.
We established an eight-gene hierarchical clustering based on signature genes associated with survival in gastric cancer. Survival curves showed that the overall survival of patients expressing cluster 1 was significantly longer than that of patients expressing cluster 2. This clustering analysis further demonstrates the important role of these feature genes when evaluating the survival of gastric cancer patients.
Our study presents several limitations. The data for this study come from public databases and our results lack experimental validation. Our results should be validated in large studies. Our results considered only the developmental stage of gastric cancer and did not take into account other clinical features such as metastatic recurrence. More in-depth analysis is needed in future studies.
Conclusions
This bioinformatic study identified potential prognostic genes related to the development of gastric cancer that may be useful as potential markers and therapeutic targets. Our data support the potential of key genes, especially LRFN4, as diagnostic and prognostic biomarkers of gastric cancer.
Supplementary Materials
Author Contributions
Zhihu Huang and Wenwei Nong conceived and designed the study. Shaohua Huang and Liping Ma conducted data analysis and interpretation. Biyang Lan and Ning Liu collected and assembled data. All authors participated in manuscript writing and approved the final version of the manuscript.
Conflicts of Interest
The authors declare that the research was conducted in the absence of any commercial or financial relationships that could be construed as a potential conflicts of interest.
Funding
This research was supported by the Guangxi Natural Science Foundation (No. 2018GXNSFAA050114).
References
- 1. Bray F, Ferlay J, Soerjomataram I, Siegel RL, Torre LA, Jemal A. Global cancer statistics 2018: GLOBOCAN estimates of incidence and mortality worldwide for 36 cancers in 185 countries. CA Cancer J Clin. 2018; 68:394–424. https://doi.org/10.3322/caac.21492 [PubMed]
- 2. Liu Y, Chen X, Chen X, Yang X, Song Q, Wu H. High SALM3 Expression in Tumor Cells and Fibroblasts Is Correlated with Poor Prognosis in Gastric Cancer Patients. Dis Markers. 2019; 2019:8282414. https://doi.org/10.1155/2019/8282414 [PubMed]
- 3. Yusefi AR, Bagheri Lankarani K, Bastani P, Radinmanesh M, Kavosi Z. Risk Factors for Gastric Cancer: A Systematic Review. Asian Pac J Cancer Prev. 2018; 19:591–603. https://doi.org/10.22034/APJCP.2018.19.3.591 [PubMed]
- 4. Lazăr DC, Avram MF, Romoșan I, Cornianu M, Tăban S, Goldiș A. Prognostic significance of tumor immune microenvironment and immunotherapy: Novel insights and future perspectives in gastric cancer. World J Gastroenterol. 2018; 24:3583–616. https://doi.org/10.3748/wjg.v24.i32.3583 [PubMed]
- 5. Liu K, Yang K, Wu B, Chen H, Chen X, Chen X, Jiang L, Ye F, He D, Lu Z, Xue L, Zhang W, Li Q, et al. Tumor-Infiltrating Immune Cells Are Associated With Prognosis of Gastric Cancer. Medicine (Baltimore). 2015; 94:e1631. https://doi.org/10.1097/MD.0000000000001631 [PubMed]
- 6. Machlowska J, Maciejewski R, Sitarz R. The Pattern of Signatures in Gastric Cancer Prognosis. Int J Mol Sci. 2018; 19:1658. https://doi.org/10.3390/ijms19061658 [PubMed]
- 7. Wu HH, Lin WC, Tsai KW. Advances in molecular biomarkers for gastric cancer: miRNAs as emerging novel cancer markers. Expert Rev Mol Med. 2014; 16:e1. https://doi.org/10.1017/erm.2013.16 [PubMed]
- 8. Orditura M, Galizia G, Sforza V, Gambardella V, Fabozzi A, Laterza MM, Andreozzi F, Ventriglia J, Savastano B, Mabilia A, Lieto E, Ciardiello F, De Vita F. Treatment of gastric cancer. World J Gastroenterol. 2014; 20:1635–49. https://doi.org/10.3748/wjg.v20.i7.1635 [PubMed]
- 9. Chivu-Economescu M, Matei L, Necula LG, Dragu DL, Bleotu C, Diaconu CC. New therapeutic options opened by the molecular classification of gastric cancer. World J Gastroenterol. 2018; 24:1942–61. https://doi.org/10.3748/wjg.v24.i18.1942 [PubMed]
- 10. Ding L, El Zaatari M, Merchant JL. Recapitulating Human Gastric Cancer Pathogenesis: Experimental Models of Gastric Cancer. Adv Exp Med Biol. 2016; 908:441–78. https://doi.org/10.1007/978-3-319-41388-4_22 [PubMed]
- 11. Ye DM, Xu G, Ma W, Li Y, Luo W, Xiao Y, Liu Y, Zhang Z. Significant function and research progress of biomarkers in gastric cancer. Oncol Lett. 2020; 19:17–29. https://doi.org/10.3892/ol.2019.11078 [PubMed]
- 12. Ding K, Tan S, Huang X, Wang X, Li X, Fan R, Zhu Y, Lobie PE, Wang W, Wu Z. GSE1 predicts poor survival outcome in gastric cancer patients by SLC7A5 enhancement of tumor growth and metastasis. J Biol Chem. 2018; 293:3949–64. https://doi.org/10.1074/jbc.ra117.001103 [PubMed]
- 13. Lin JX, Xie XS, Weng XF, Qiu SL, Yoon C, Lian NZ, Xie JW, Wang JB, Lu J, Chen QY, Cao LL, Lin M, Tu RH, et al. UFM1 suppresses invasive activities of gastric cancer cells by attenuating the expres7sion of PDK1 through PI3K/AKT signaling. J Exp Clin Cancer Res. 2019; 38:410. https://doi.org/10.1186/s13046-019-1416-4 [PubMed]
- 14. Li H, Li M, Tang C, Xu L. Screening and prognostic value of potential biomarkers for ovarian cancer. Ann Transl Med. 2021; 9:1007. https://doi.org/10.21037/atm-21-2627 [PubMed]
- 15. Konakahara S, Saitou M, Hori S, Nakane T, Murai K, Itoh R, Shinsaka A, Kohroki J, Kawakami T, Kajikawa M, Masuho Y. A neuronal transmembrane protein LRFN4 induces monocyte/macrophage migration via actin cytoskeleton reorganization. FEBS Lett. 2011; 585:2377–84. https://doi.org/10.1016/j.febslet.2011.06.011 [PubMed]
- 16. Neame PJ, Choi HU, Rosenberg LC. The primary structure of the core protein of the small, leucine-rich proteoglycan (PG I) from bovine articular cartilage. J Biol Chem. 1989; 264:8653–61. https://doi.org/10.1016/S0021-9258(18)81842-7 [PubMed]
- 17. Okamoto O, Fujiwara S, Abe M, Sato Y. Dermatopontin interacts with transforming growth factor beta and enhances its biological activity. Biochem J. 1999; 337:537–41. https://doi.org/10.1042/bj3370537 [PubMed]
- 18. Huang H, Hao Z, Long L, Yin Z, Wu C, Zhou X, Zhang B. Dermatopontin as a potential pathogenic factor in endometrial cancer. Oncol Lett. 2021; 21:408. https://doi.org/10.3892/ol.2021.12669 [PubMed]
- 19. Saxena AK. Pectus less invasive extrapleural repair (PLIER). J Plast Reconstr Aesthet Surg. 2009; 62:663–8. https://doi.org/10.1016/j.bjps.2007.12.027 [PubMed]
- 20. Robinson MD, Speed TP. Differential splicing using whole-transcript microarrays. BMC Bioinformatics. 2009; 10:156. https://doi.org/10.1186/1471-2105-10-156 [PubMed]
- 21. Love MI, Huber W, Anders S. Moderated estimation of fold change and dispersion for RNA-seq data with DESeq2. Genome Biol. 2014; 15:550. https://doi.org/10.1186/s13059-014-0550-8 [PubMed]
- 22. Ritchie ME, Phipson B, Wu D, Hu Y, Law CW, Shi W, Smyth GK. limma powers differential expression analyses for RNA-sequencing and microarray studies. Nucleic Acids Res. 2015; 43:e47. https://doi.org/10.1093/nar/gkv007 [PubMed]
- 23. Langfelder P, Horvath S. WGCNA: an R package for weighted correlation network analysis. BMC Bioinformatics. 2008; 9:559. https://doi.org/10.1186/1471-2105-9-559 [PubMed]
- 24. Yu G, Wang LG, Han Y, He QY. clusterProfiler: an R package for comparing biological themes among gene clusters. OMICS. 2012; 16:284–87. https://doi.org/10.1089/omi.2011.0118 [PubMed]
- 25. Subramanian A, Tamayo P, Mootha VK, Mukherjee S, Ebert BL, Gillette MA, Paulovich A, Pomeroy SL, Golub TR, Lander ES, Mesirov JP. Gene set enrichment analysis: a knowledge-based approach for interpreting genome-wide expression profiles. Proc Natl Acad Sci U S A. 2005; 102:15545–50. https://doi.org/10.1073/pnas.0506580102 [PubMed]
- 26. Hänzelmann S, Castelo R, Guinney J. GSVA: gene set variation analysis for microarray and RNA-seq data. BMC Bioinformatics. 2013; 14:7. https://doi.org/10.1186/1471-2105-14-7 [PubMed]
- 27. Bindea G, Mlecnik B, Tosolini M, Kirilovsky A, Waldner M, Obenauf AC, Angell H, Fredriksen T, Lafontaine L, Berger A, Bruneval P, Fridman WH, Becker C, et al. Spatiotemporal dynamics of intratumoral immune cells reveal the immune landscape in human cancer. Immunity. 2013; 39:782–95. https://doi.org/10.1016/j.immuni.2013.10.003 [PubMed]
- 28. Ernst J, Bar-Joseph Z. STEM: a tool for the analysis of short time series gene expression data. BMC Bioinformatics. 2006; 7:191. https://doi.org/10.1186/1471-2105-7-191 [PubMed]
- 29. Tian Y, Morris TJ, Webster AP, Yang Z, Beck S, Feber A, Teschendorff AE. ChAMP: updated methylation analysis pipeline for Illumina BeadChips. Bioinformatics. 2017; 33:3982–4. https://doi.org/10.1093/bioinformatics/btx513 [PubMed]
- 30. Mayakonda A, Lin DC, Assenov Y, Plass C, Koeffler HP. Maftools: efficient and comprehensive analysis of somatic variants in cancer. Genome Res. 2018; 28:1747–56. https://doi.org/10.1101/gr.239244.118 [PubMed]
- 31. Robin X, Turck N, Hainard A, Tiberti N, Lisacek F, Sanchez JC, Müller M. pROC: an open-source package for R and S+ to analyze and compare ROC curves. BMC Bioinformatics. 2011; 12:77. https://doi.org/10.1186/1471-2105-12-77 [PubMed]
- 32. Necula L, Matei L, Dragu D, Neagu AI, Mambet C, Nedeianu S, Bleotu C, Diaconu CC, Chivu-Economescu M. Recent advances in gastric cancer early diagnosis. World J Gastroenterol. 2019; 25:2029–44. https://doi.org/10.3748/wjg.v25.i17.2029 [PubMed]
- 33. Protti MP, De Monte L. Thymic Stromal Lymphopoietin and Cancer: Th2-Dependent and -Independent Mechanisms. Front Immunol. 2020; 11:2088. https://doi.org/10.3389/fimmu.2020.02088 [PubMed]
- 34. Yao Y, Jiang Q, Jiang L, Wu J, Zhang Q, Wang J, Feng H, Zang P. Lnc-SGK1 induced by Helicobacter pylori infection and highsalt diet promote Th2 and Th17 differentiation in human gastric cancer by SGK1/Jun B signaling. Oncotarget. 2016; 7:20549–60. https://doi.org/10.18632/oncotarget.7823 [PubMed]
- 35. Eissmann MF, Dijkstra C, Jarnicki A, Phesse T, Brunnberg J, Poh AR, Etemadi N, Tsantikos E, Thiem S, Huntington ND, Hibbs ML, Boussioutas A, Grimbaldeston MA, et al. IL-33-mediated mast cell activation promotes gastric cancer through macrophage mobilization. Nat Commun. 2019; 10:2735. https://doi.org/10.1038/s41467-019-10676-1 [PubMed]
- 36. Sammarco G, Varricchi G, Ferraro V, Ammendola M, De Fazio M, Altomare DF, Luposella M, Maltese L, Currò G, Marone G, Ranieri G, Memeo R. Mast Cells, Angiogenesis and Lymphangiogenesis in Human Gastric Cancer. Int J Mol Sci. 2019; 20:2106. https://doi.org/10.3390/ijms20092106 [PubMed]
- 37. Lv Y, Zhao Y, Wang X, Chen N, Mao F, Teng Y, Wang T, Peng L, Zhang J, Cheng P, Liu Y, Kong H, Chen W, et al. Increased intratumoral mast cells foster immune suppression and gastric cancer progression through TNF-α-PD-L1 pathway. J Immunother Cancer. 2019; 7:54. https://doi.org/10.1186/s40425-019-0530-3 [PubMed]
- 38. Kuang M, Cheng J, Zhang C, Feng L, Xu X, Zhang Y, Zu M, Cui J, Yu H, Zhang K, Yang A, Cheng S. A novel signature for stratifying the molecular heterogeneity of the tissue-infiltrating T-cell receptor repertoire reflects gastric cancer prognosis. Sci Rep. 2017; 7:7762. https://doi.org/10.1038/s41598-017-08289-z [PubMed]
- 39. Wei M, Shen D, Mulmi Shrestha S, Liu J, Zhang J, Yin Y. The Progress of T Cell Immunity Related to Prognosis in Gastric Cancer. Biomed Res Int. 2018; 2018:3201940. https://doi.org/10.1155/2018/3201940 [PubMed]
- 40. Kim KY, Yi BR, Lee HR, Kang NH, Jeung EB, Kim SU, Choi KC. Stem cells with fused gene expression of cytosine deaminase and interferon-β migrate to human gastric cancer cells and result in synergistic growth inhibition for potential therapeutic use. Int J Oncol. 2012; 40:1097–104. https://doi.org/10.3892/ijo.2011.1288 [PubMed]
- 41. Meng X, Yu X, Dong Q, Xu X, Li J, Xu Q, Ma J, Zhou C. Distribution of circulating follicular helper T cells and expression of interleukin-21 and chemokine C-X-C ligand 13 in gastric cancer. Oncol Lett. 2018; 16:3917–22. https://doi.org/10.3892/ol.2018.9112 [PubMed]
- 42. Sokolova O, Naumann M. NF-κB Signaling in Gastric Cancer. Toxins (Basel). 2017; 9:119. https://doi.org/10.3390/toxins9040119 [PubMed]
- 43. Judd LM, Menheniott TR, Ling H, Jackson CB, Howlett M, Kalantzis A, Priebe W, Giraud AS. Inhibition of the JAK2/STAT3 pathway reduces gastric cancer growth in vitro and in vivo. PLoS One. 2014; 9:e95993. https://doi.org/10.1371/journal.pone.0095993 [PubMed]
- 44. Hao NB, Tang B, Wang GZ, Xie R, Hu CJ, Wang SM, Wu YY, Liu E, Xie X, Yang SM. Hepatocyte growth factor (HGF) upregulates heparanase expression via the PI3K/Akt/NF-κB signaling pathway for gastric cancer metastasis. Cancer Lett. 2015; 361:57–66. https://doi.org/10.1016/j.canlet.2015.02.043 [PubMed]
- 45. Piazuelo MB, Riechelmann RP, Wilson KT, Algood HMS. Resolution of Gastric Cancer-Promoting Inflammation: A Novel Strategy for Anti-cancer Therapy. Curr Top Microbiol Immunol. 2019; 421:319–59. https://doi.org/10.1007/978-3-030-15138-6_13 [PubMed]
- 46. Javaid N, Choi S. Toll-like Receptors from the Perspective of Cancer Treatment. Cancers (Basel). 2020; 12:297. https://doi.org/10.3390/cancers12020297 [PubMed]
- 47. Meliț LE, Mărginean CO, Mărginean CD, Mărginean MO. The Relationship between Toll-like Receptors and Helicobacter pylori-Related Gastropathies: Still a Controversial Topic. J Immunol Res. 2019; 2019:8197048. https://doi.org/10.1155/2019/8197048 [PubMed]
- 48. Tian P, Liang C. Transcriptome profiling of cancer tissues in Chinese patients with gastric cancer by high-throughput sequencing. Oncol Lett. 2018; 15:2057–64. https://doi.org/10.3892/ol.2017.7548 [PubMed]
- 49. Yamatoji M, Kasamatsu A, Kouzu Y, Koike H, Sakamoto Y, Ogawara K, Shiiba M, Tanzawa H, Uzawa K. Dermatopontin: a potential predictor for metastasis of human oral cancer. Int J Cancer. 2012; 130:2903–11. https://doi.org/10.1002/ijc.26328 [PubMed]
- 50. Unamuno X, Gómez-Ambrosi J, Ramírez B, Rodríguez A, Becerril S, Valentí V, Moncada R, Silva C, Salvador J, Frühbeck G, Catalán V. Dermatopontin, A Novel Adipokine Promoting Adipose Tissue Extracellular Matrix Remodelling and Inflammation in Obesity. J Clin Med. 2020; 9:1069. https://doi.org/10.3390/jcm9041069 [PubMed]
- 51. Hu G, Sun N, Jiang J, Chen X. Establishment of a 5-gene risk model related to regulatory T cells for predicting gastric cancer prognosis. Cancer Cell Int. 2020; 20:433. https://doi.org/10.1186/s12935-020-01502-6 [PubMed]