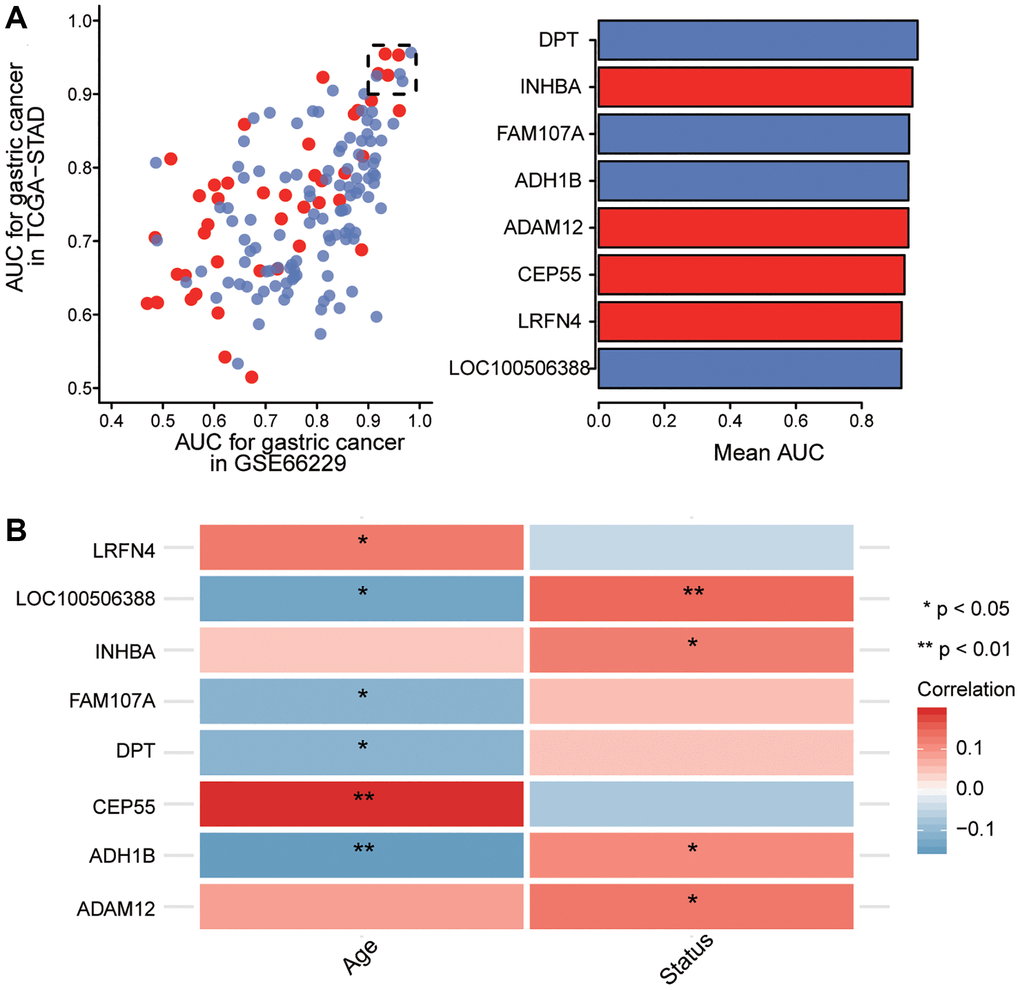
Figure 6.Screening of key genes. (A) Identification of key genes with areas under the receiving operating characteristic curve (AUCs) greater than 0.9 in The Cancer Genome Atlas (TCGA) and GSE66229. Red indicates up-regulated expression and blue, down-regulated. (B) Correlation of key gene expression with age and overall survival of gastric cancer patients in the TCGA dataset. Red indicates a positive correlation and blue, a negative correlation. *P < 0.05, **P < 0.01.