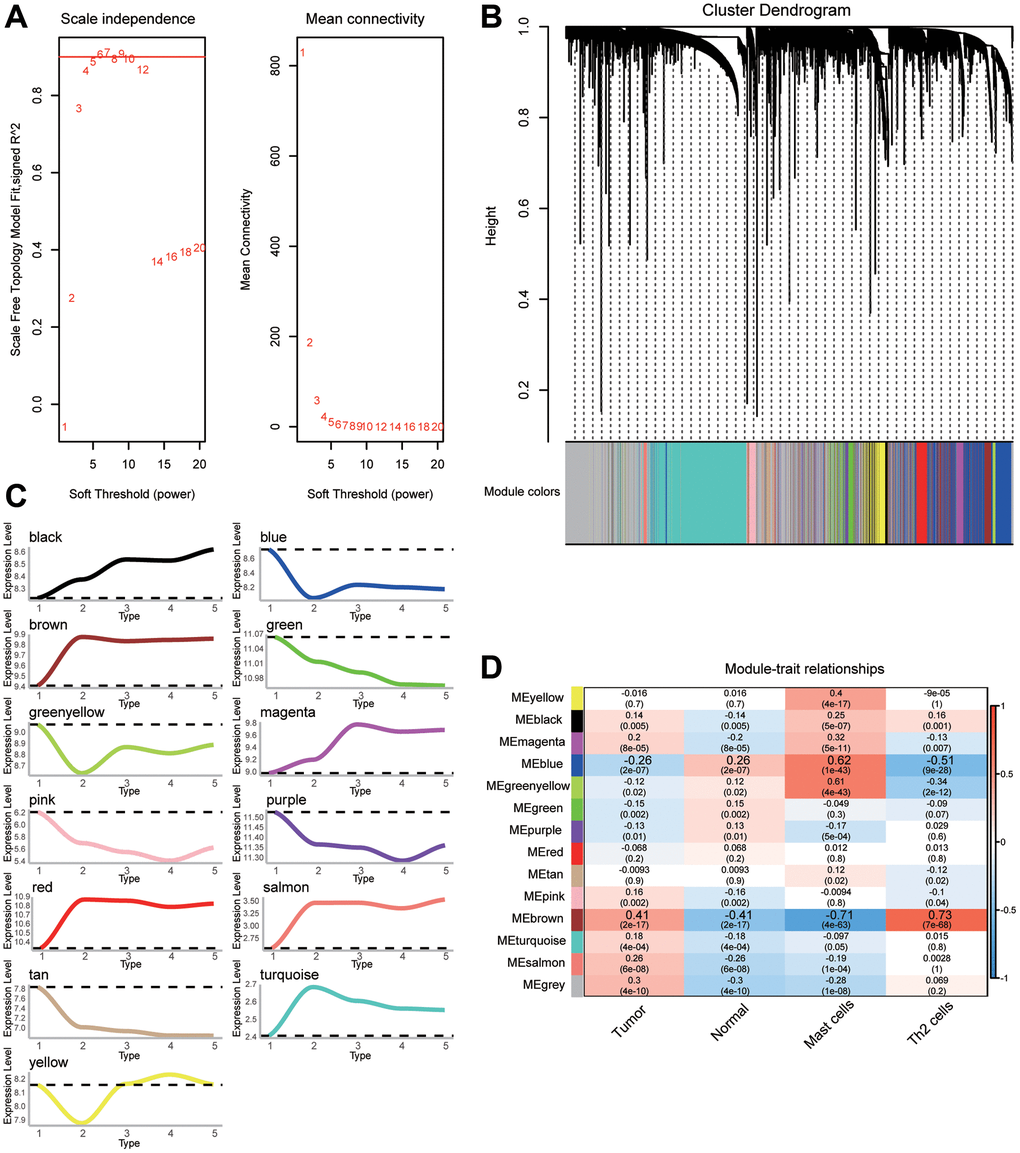
Figure 3.The weighted gene coexpression network analysis (WGCNA) network for selected genes. (A) Analysis of the scale-free fit index and the mean connectivity for various soft-thresholding powers (β). (B) Cluster dendrogram of differentially expressed genes (DEGs) showing similar expression trends. (C) Up- or downregulation trend of gene modules. (D) Heatmap of the correlation between gene modules and clinical traits.