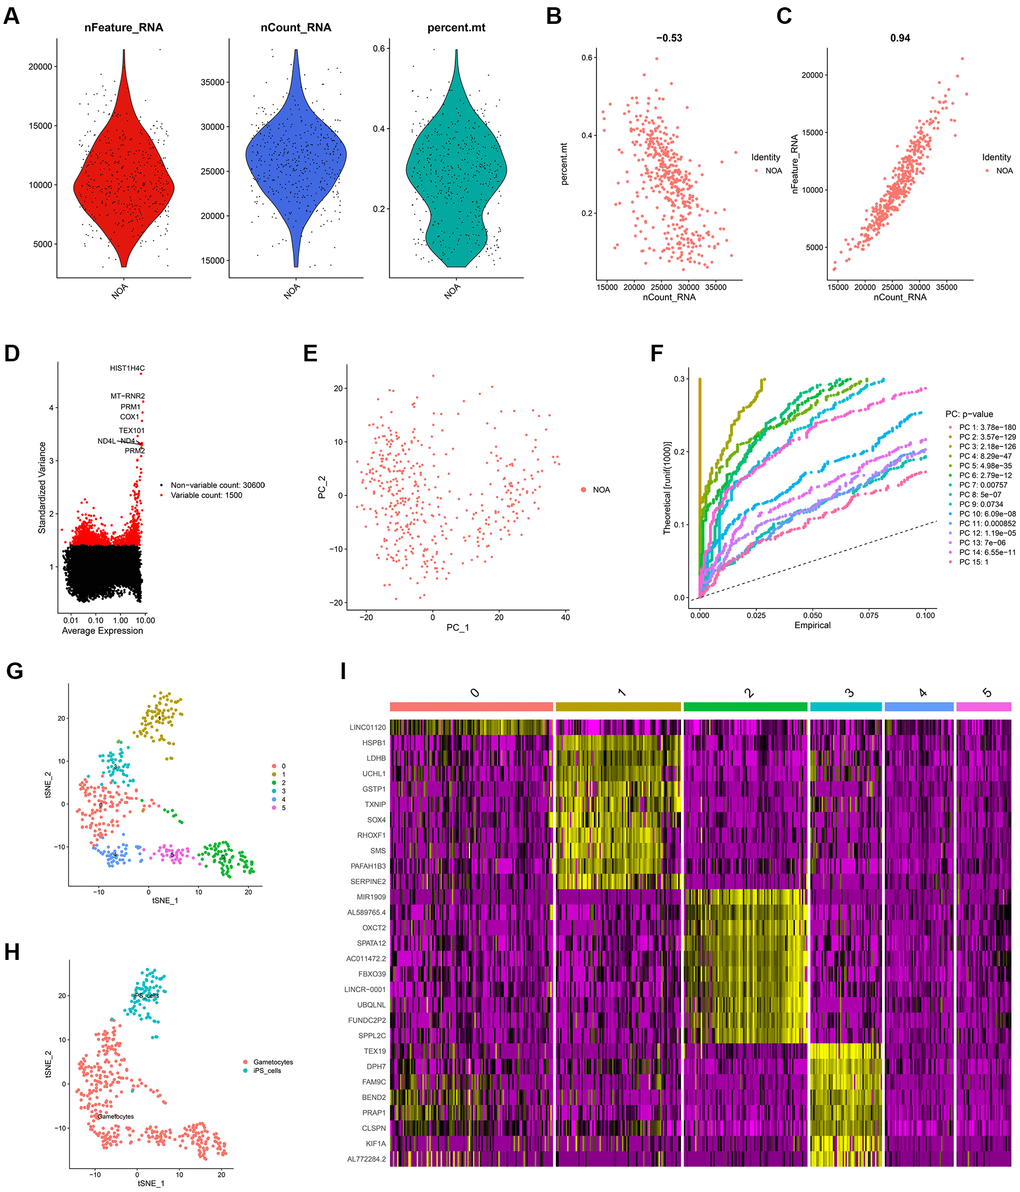
Figure 2.The identification of cell markers via scRNA-seq analysis. (A) The quality control chart. (B, C) The association of detected gene counts with the percent of mitochondrial genes (B) and sequencing depth (C). (D) The Top 10 genes with the most differentially expressed among various cell samples. (E) The PCA analysis. (F) The P-values of each PC. (G) The cell samples were divided into 5 clusters. (H) The cell type annotation. (I) The heat map indicating the expression level of the cell markers in different cell clusters. scRNA-seq, single-cell RNA sequencing; PCA, principal component analysis; PC, principal component.