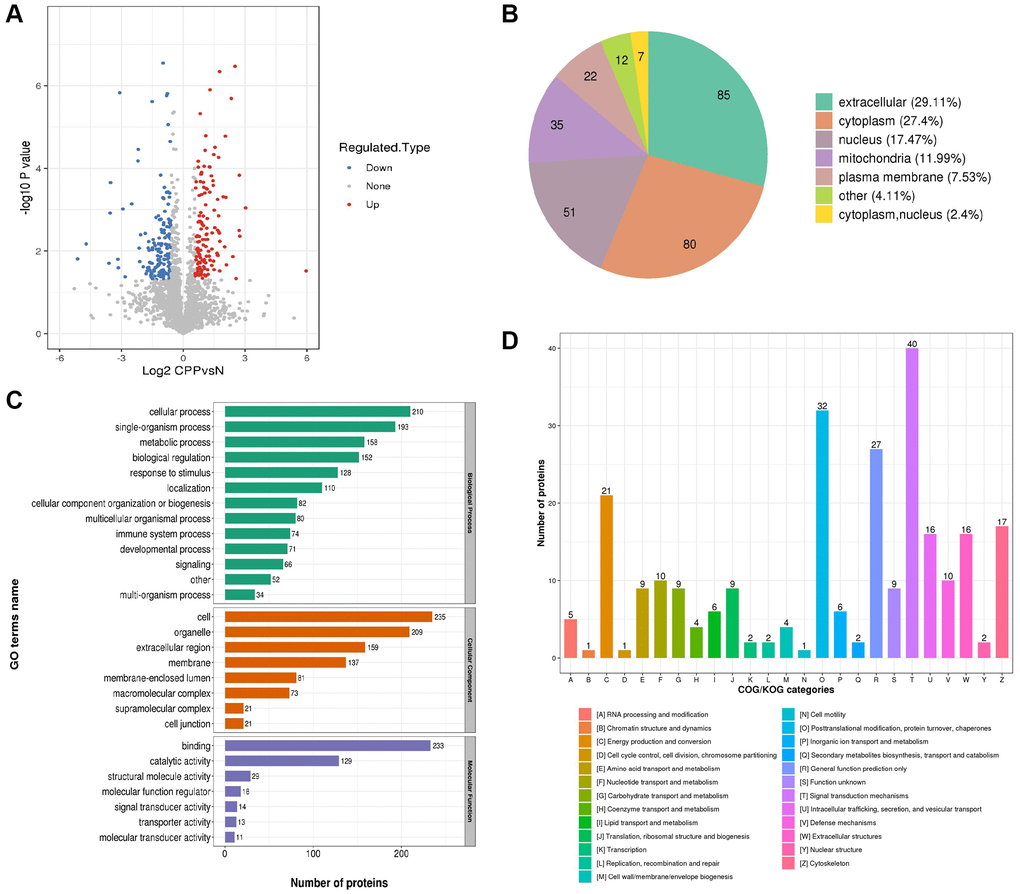
Figure 4.Global proteomics analyses of the identified differentially expressed proteins in CPP. (A) The horizontal axis and vertical axis of the volcano plot was the logarithmically converted value of the relative quantitative value of the protein and logarithmically converted p-value after the log-log conversion, respectively. In the volcano plot, the red dot indicated significantly up regulated proteins and the blue dot indicated significantly down regulated proteins. The p-value was calculated using the two-sample t-test method. (B) Clusters of Orthologous Groups of differentially expressed proteins. (C) Sub cellular Localization and classification of differentially expressed proteins. (D) The up regulated proteins and down regulated proteins between two groups via Enrichment of GO analysis.