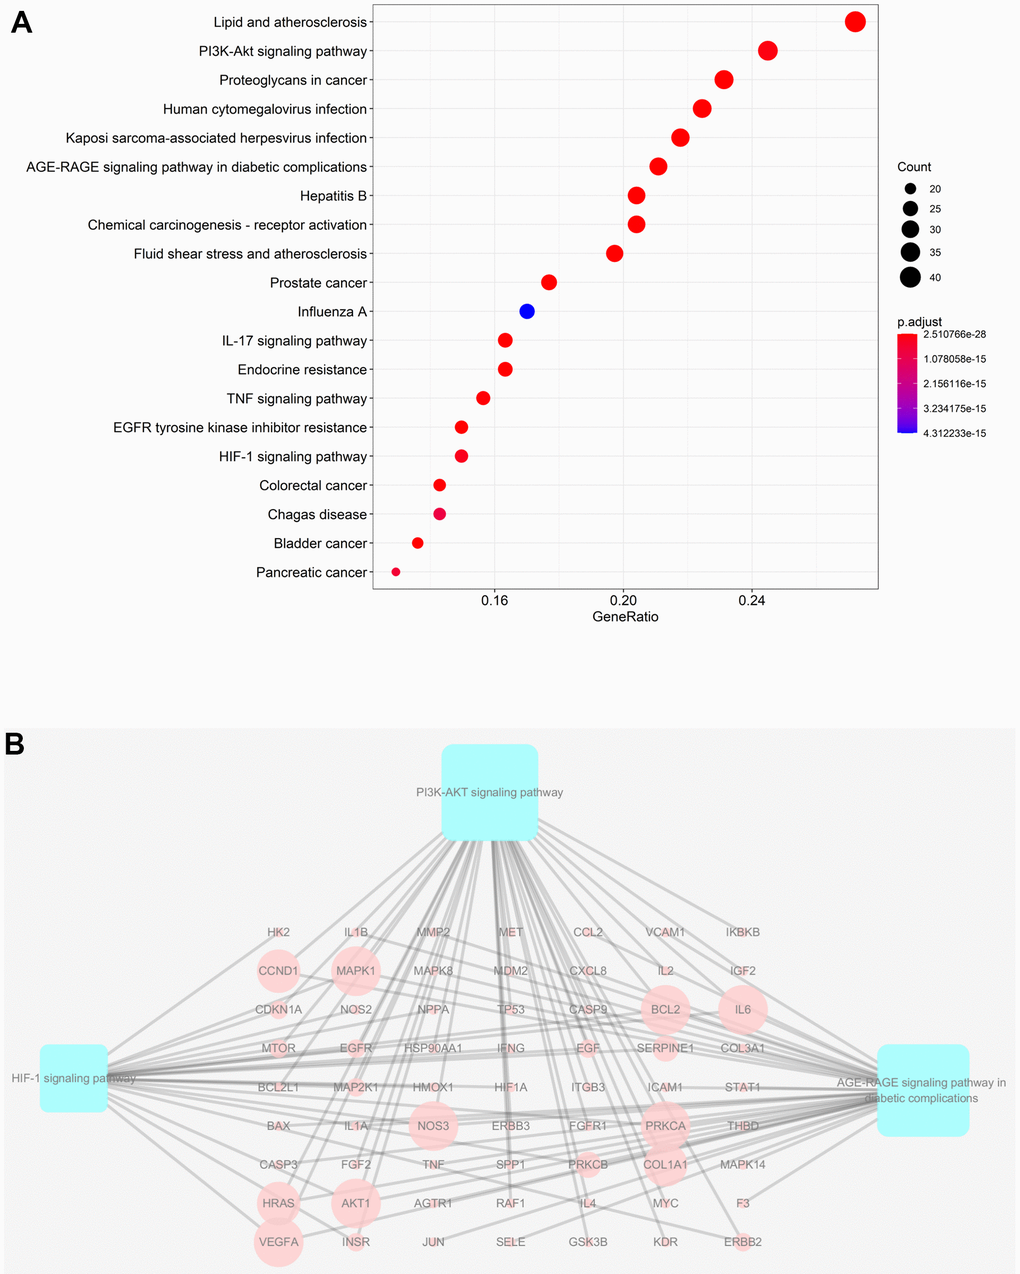
Figure 6.KEGG analysis of major targets of JDTL. (A) The 20 pathways with the lowest adjusted P values. The x-axis and the y-axis represent the counts of the target symbols in each pathway and the main pathway, respectively. (P < 0.05) (B) Sub-network showing KEGG pathways and related genes.