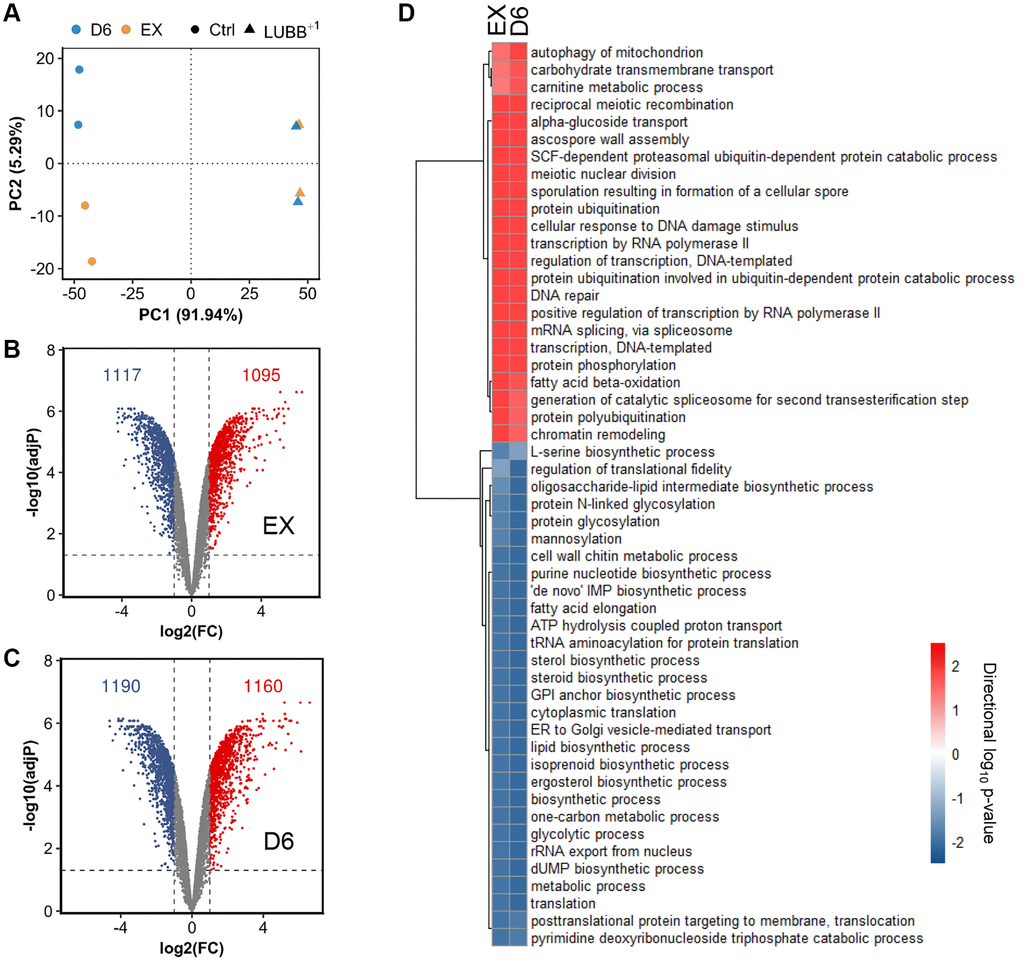
Figure 1.The global transcriptional response to constitutively low UBB+1 expression. (A) Principal Component Analysis (PCA) of the normalized microarray data. (B–C) Volcano plot of log2(FC) (Fold change) vs adjusted p value of differentially expressed genes comparing L-UBB+1 strain and control strain during EX (B) and D6 (C). The dashed vertical grey line indicates the threshold of log2(FC) (≤ -1 or ≥ 1), while the horizontal grey line indicates statistical significance threshold of adjusted p value < 0.05. (D) The significantly enriched GO terms in L-UBB+1 strain compared to control strain during EX and D6 phases. The red color indicates upregulated processes and blue color indicates downregulated processes. Samples are biological duplicates.