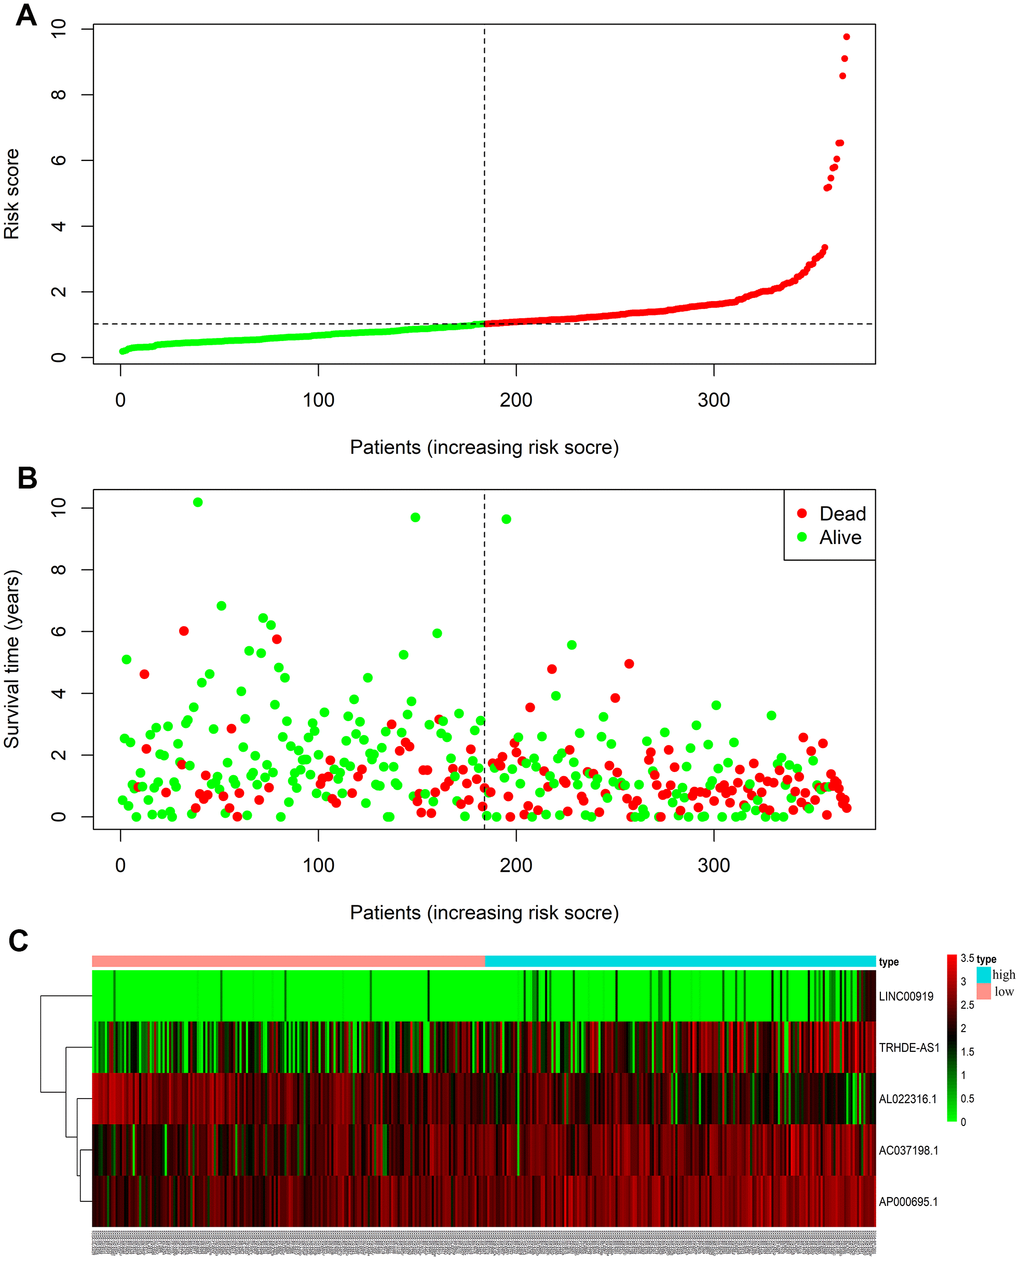
Figure 3.LncRNA predictive risk-score analysis of GC patients in TCGA database (The black dotted line represents the median signature cut-off dividing patients into low- and high-risk groups). (A) LncRNA risk score distribution in low- and high-risk groups (The green dots represent the low-risk patients, and red means the high-risk group). (B) The survival status and time of GC patients in low- and high-risk groups (The green dots represent alive, and red means dead). (C) Heatmap of the five-lncRNA expression profiles in GC patients.