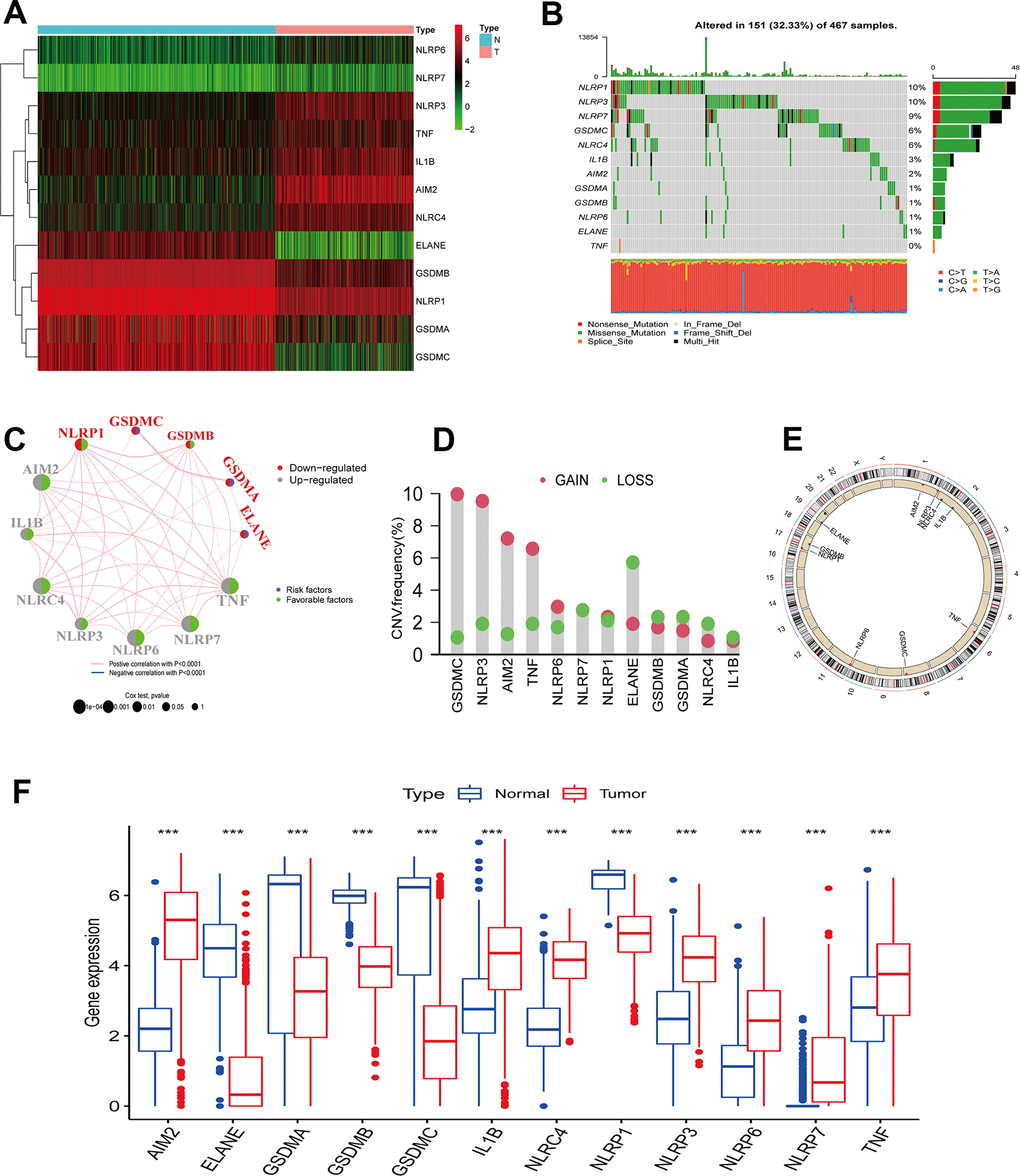
Figure 1.PRGs genetic variation landscape in cutaneous melanoma. (A) Heatmap of differential PRGs expression between normal skin tissue and cutaneous melanoma. Blue represents normal skin tissue, pink represents tumor tissue; upregulated genes were defined as red, and downregulated genes as green. (B) Mutation characteristics of 12 PRGs in the TCGA-CM cohort. The TMB is presented in the barplot at the top of the image; the mutation frequency of each PRGs is indicated on the barplot right. The barplot on the right represents different mutation types proportions. (C) Interaction circle diagram of the 12 PRGs in CM. Larger circles represent a greater CM prognostic impact. Dark blue inside the circle represents a risk prognostic factor and green a protective factor. The connecting lines between each PRG represent interactions. Pink represents the positive correlation between PRGs, and blue a negative correlation. Upregulated PRGs are marked in gray, and downregulated PRGs in red. p-values for Cox analysis ranged from: p < 1e-04, p < 0.001, p < 0.01, p < 0.05, p < 1. (D) PRG CNA variants frequency in the TCGA cutaneous melanoma cohort. Red: amplification frequency. Green: loss frequency. (E) CNA variants located on 23 chromosomes for 12 PRGs in the TCGA-CM cohort. (F) Expression of 12 PRGs between normal skin tissue and CM. Blue: normal skin tissue. Red: tumor tissue. (*p < 0.05; **p < 0.01; ***p < 0.001).