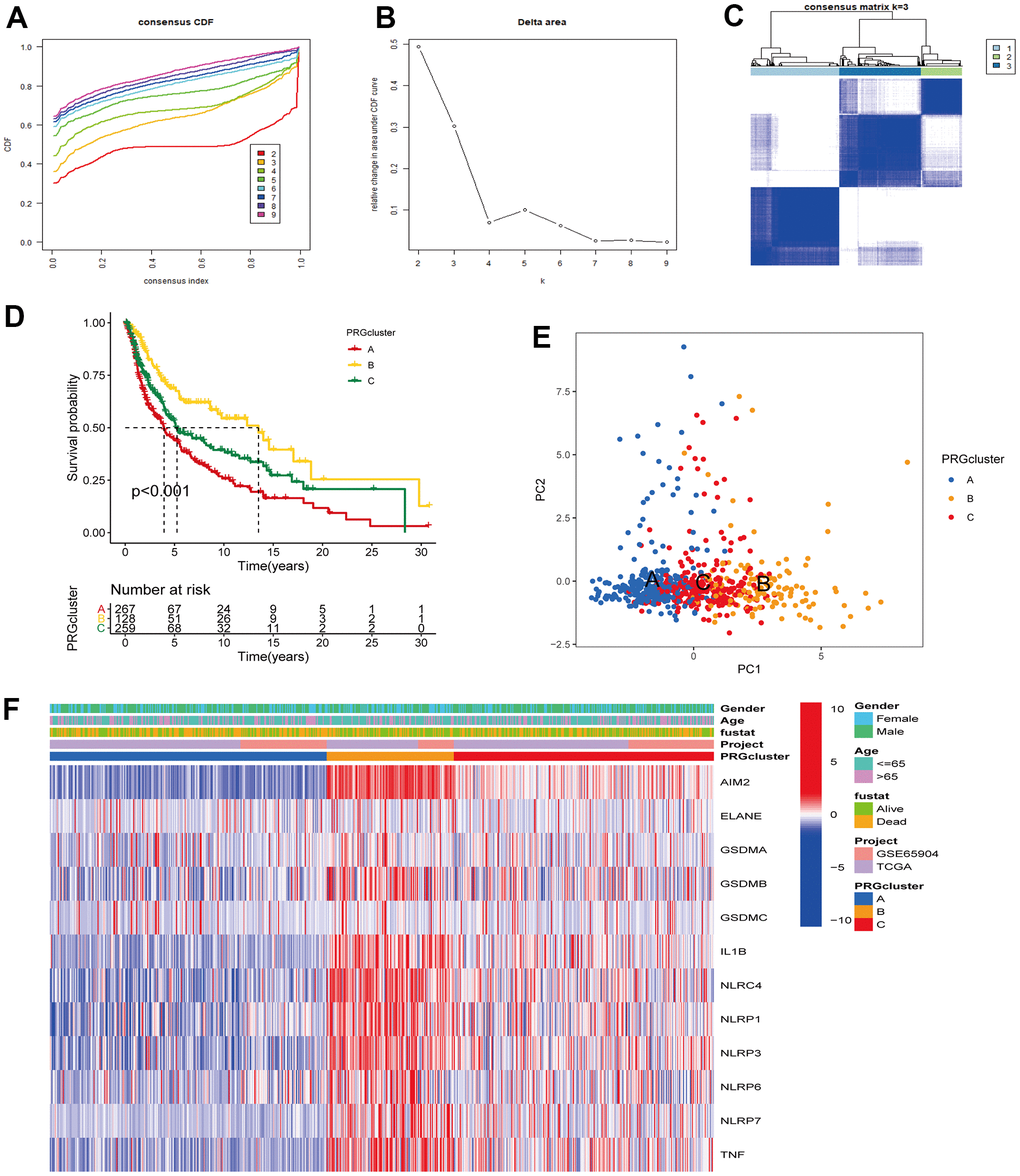
Figure 2.Unsupervised cluster analysis classified CM patients into different subclusters. (A, B) Consensus clustering cumulative distribution function (CDF) and relative change in the area under the CDF curve when K = 2-9. (C) Consensus clustering matrix in PRG modification patterns when K = 3. (D) Survival analysis curve of three PRG modification patterns in CM from TCGA, and GSE65904 cohorts. Red: PRG cluster A; orange: PRG cluster B; green: PRG cluster C. Log-rank p < 0.001, indicating a significant difference in OS between the three PRG modification patterns. Among them, cluster B OS was significantly better than A and C. (E) Principal component analysis (PCA) of three PRG modification patterns gene expression profiles. Blue represents PRG cluster A, orange PRG cluster B, and red PRG cluster C. (F) Unsupervised clustering heatmap of 12 PRGs in CM. PRG clusters, age, gender, and survival status were used as patient annotations. Red represents high PRG expression and blue low PRG expression.