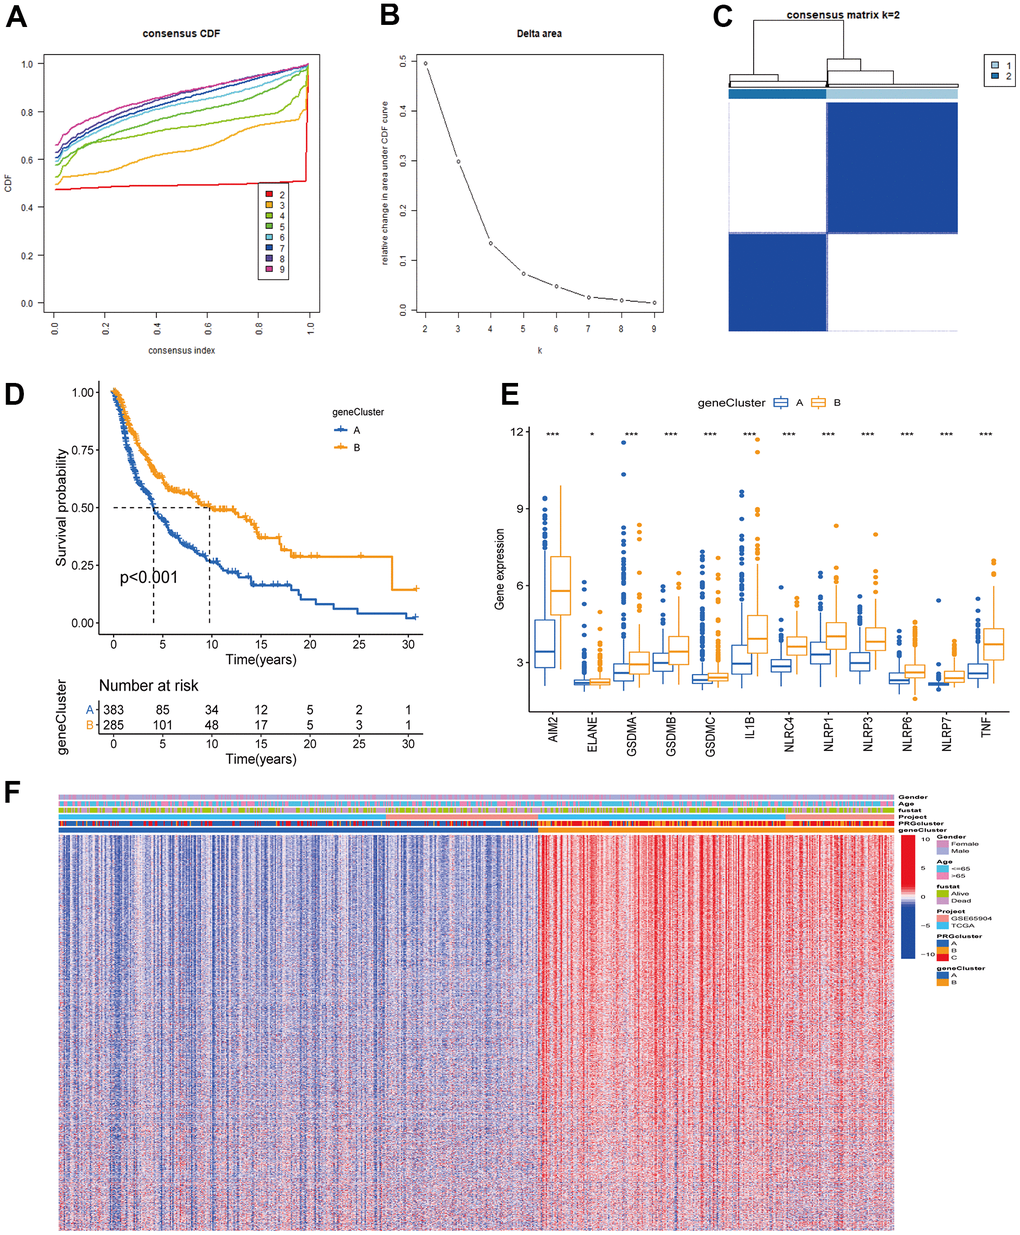
Figure 5.Unsupervised clustering analysis based on PRG signature genes was used to classify CM patients into different gene clusters. (A, B) Consensus clustering cumulative distribution function (CDF) and relative change in the area under the CDF curve when K = 2-9. (C) The consensus clustering matrix at K = 2. CM patients were divided into two gene clusters, defined as gene clusters A and B. (D) Survival analysis curves between gene cluster A and B. Blue: gene cluster A; orange: gene cluster B. Log-rank test p < 0.001 indicates that the OS between gene cluster A and B is significantly different. Gene cluster B OS was significantly better than gene cluster A. (E) Expression of 12 PRGs between gene clusters A and B. (F) Unsupervised clustering analysis heatmap of PRG signature genes. Age, gender, survival status, PRG clusters, and gene clusters are alternatively annotated. Red represents high gene expression, blue the opposite.