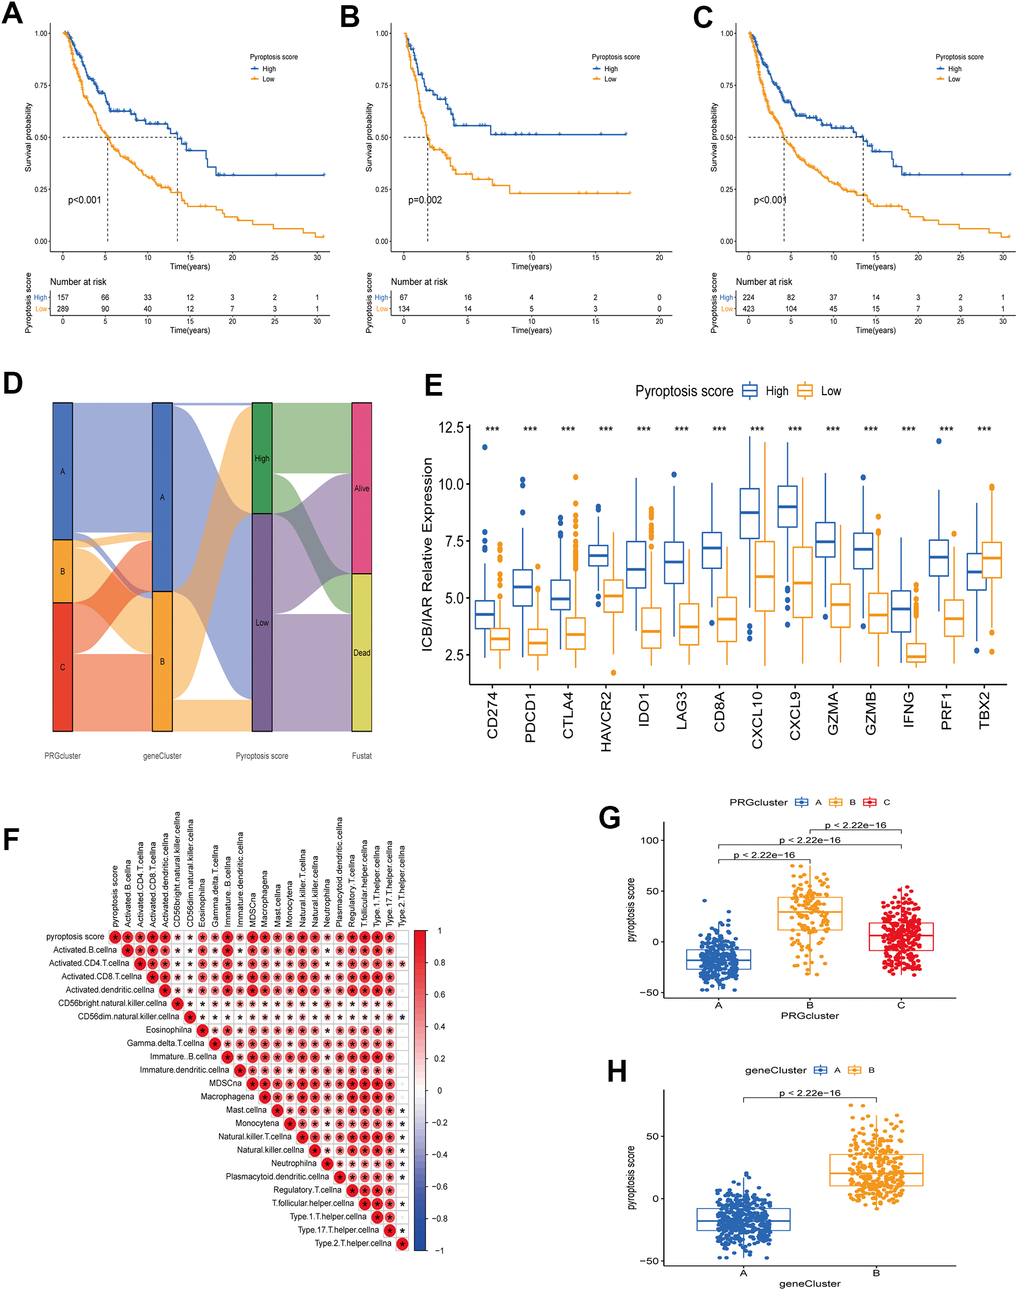
Figure 6.Construction of a quantitative index pyroptosis score. (A–C) Survival analysis curves of high and low pyroptosis score groups between different cohorts. Blue represents high scores, orange low scores. (A) TCGA cohort. (B) GSE65904 cohort. (C) TCGA combined with GSE65904 cohort. (D) Alluvial plots of the distribution of different PRG clusters, gene clusters, Pyroptosis scores, and survival outcomes. (E) Expression of immune check blocking genes (CD274, PDCD1, CTLA4, HAVCR2, IDO1, LAG3) and immune activation related genes (CD8A, CXCL10, CXCL9, GZMA, GZMB, IFNG, PRF1, TBX2) between high and low pyroptosis score groups. (F) Correlation analysis between TME immune cell infiltration and pyroptosis score. Larger circles in the box represent higher correlations. Red: positive correlation; blue: negative correlation. (G) Differences in pyroptosis scores between the three PRG modification patterns. The differences between the three subclusters were analyzed using the Kruskal-Wallis test (p < 0.001). (H) Differences in pyroptosis scores between two gene clusters (A and B). The differences between the two subclusters were analyzed using Wilcoxon rank-sum test (p < 0.001).