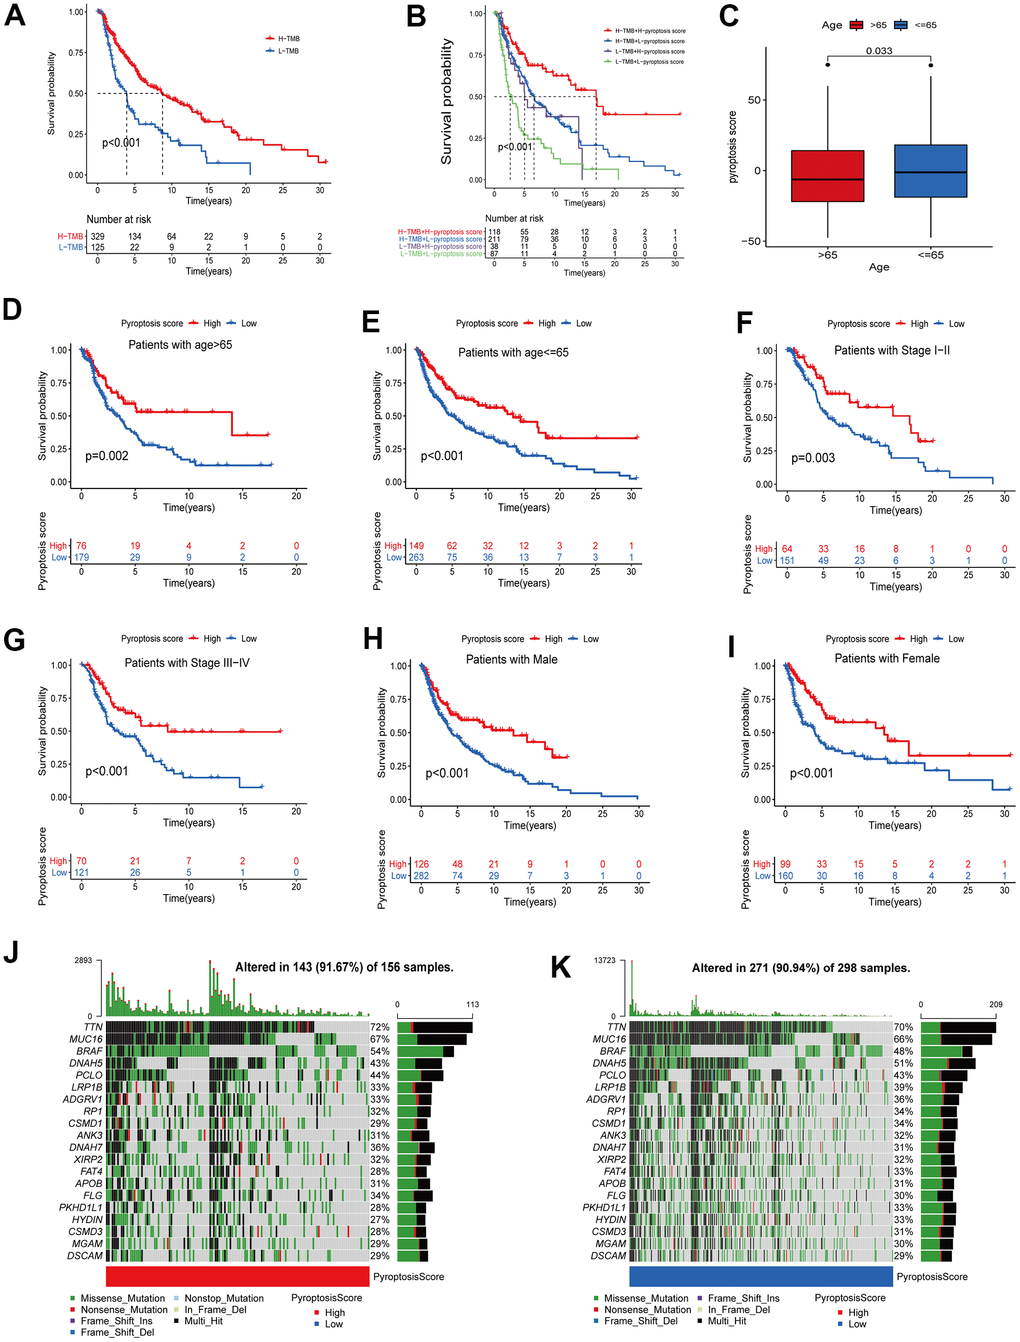
Figure 7.Correlation analysis between pyroptosis score and different clinicopathological features. (A) The survival between high and low TMB groups in the TCGA-CM cohort was analyzed using Kaplan-Meier curves (p < 0.001, Log-rank test). (B) Survival analysis of patients in the TCGA-CM cohort stratified by pyroptosis score and TMB was performed using Kaplan-Meier curves (p < 0.001, Log-rank test). (C) Differences in pyroptosis scores between age subgroups. The differences between the two subclusters were analyzed using Wilcoxon rank-sum test (p < 0.001). Red represents > 65 years and blue ≤ 65 years. (D–I) Survival curves between high pyroptosis score group and low pyroptosis score group for different clinical characteristics. The statistical difference was analyzed using a log-rank test. ((D) Patients with age > 65, p = 0.002; (E) Patients with age ≤ 65, p < 0.001; (F) Patients with stage I-II, p < 0.003; (G) Patients with stage III-IV, p < 0.001; (H) Male patient cohort, p < 0.001; (I) Female patient cohort, p < 0.001). (J, K) The waterfall plots of tumor somatic mutation were established based on the high (J) and low (K) pyroptosis score groups. The numbers on the graph represent the mutation frequencies. The box on the right represents the mutation types proportion. The barplot at the top shows TMB.