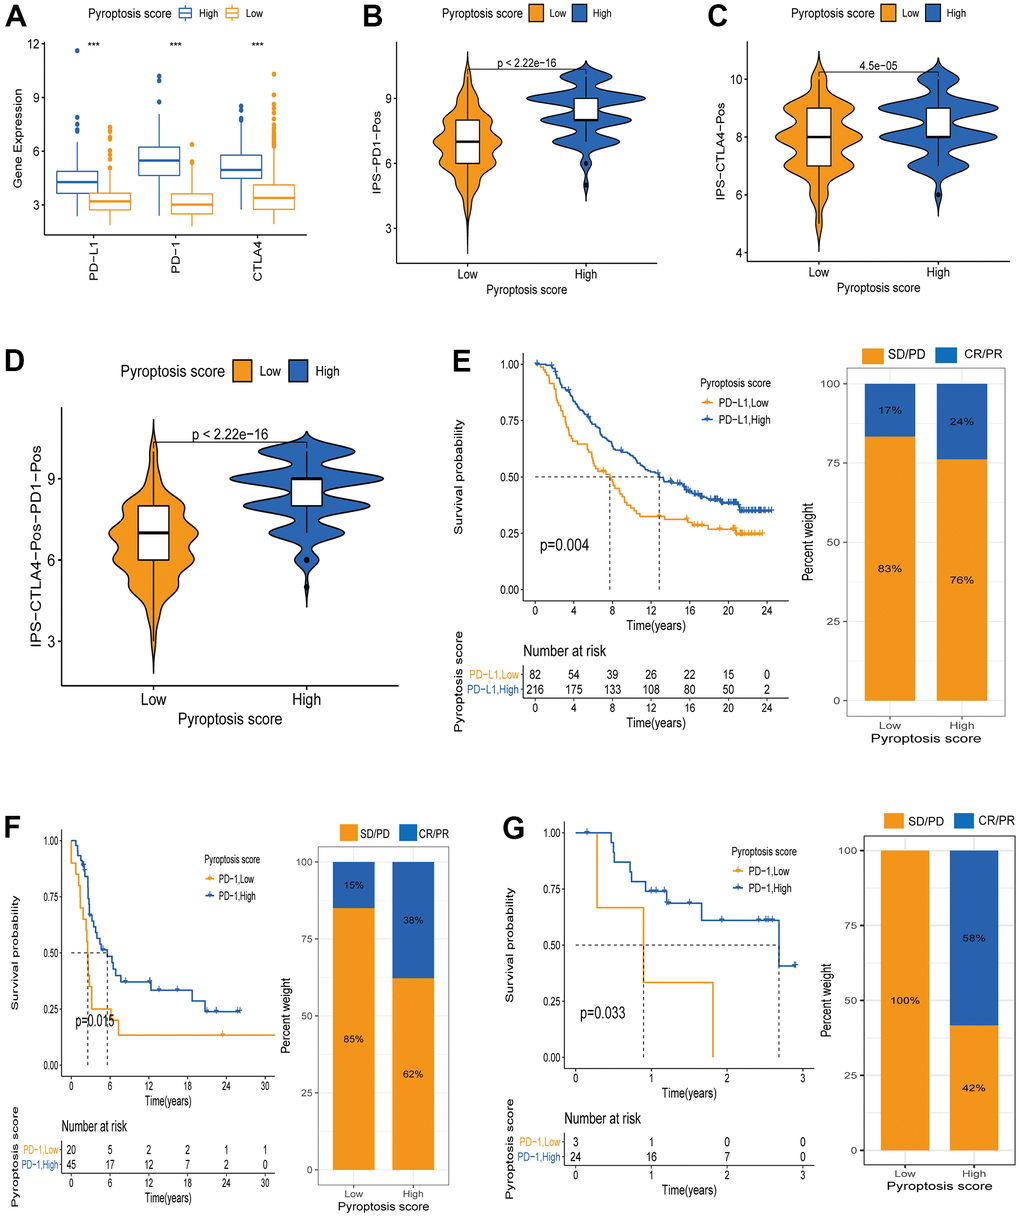
Figure 8.Pyroptosis score predicts immunotherapy benefit in cancer patients. (A) ICB genes expression (PD-L1, PD-1, CTLA4) between high and low pyroptosis score groups. (B–D) Immunophenscore (IPS) between high and low pyroptosis score groups. Blue represents the high-score group and orange the low-score group. The thick line within the violin plot represents the median value. The inner box between the top and bottom represents the interquartile range. (B) IPS score when PD-1 positive; (C) IPS score when CTLA4 positive; (D) IPS score when both PD-1 and CTLA4 positives. (E) Kaplan-Meier curves for survival analysis between high (n = 216) and low (n = 82) pyroptosis score groups in the IMvigor210 cohort receiving anti-PD-L1 therapy. Proportion of patients responding to immunotherapy between high and low pyroptosis score groups (SD/PD: stable disease/progressive disease; CR/PR: complete response /partial response. Response/Non-response: 17%/83% in low pyroptosis score; Response/Non-response: 24%/76% in high pyroptosis score). (F) Kaplan-Meier curves for survival analysis between high (n = 45) and low (n = 20) pyroptosis scores in the GSE93157 cohort receiving anti-PD-1 therapy (Response/Non-response: 15%/85% in low pyroptosis score; Response/Non-response: 38%/62% in high pyroptosis score). (G) Survival curves between the groups with high pyroptosis score (n = 24) and low (n = 3) pyroptosis score in the GSE78220 cohort receiving anti-PD-1 therapy (Response/Non-response: 0/100% in low pyroptosis score; Response/Non-response: 58%/42% in high pyroptosis score).