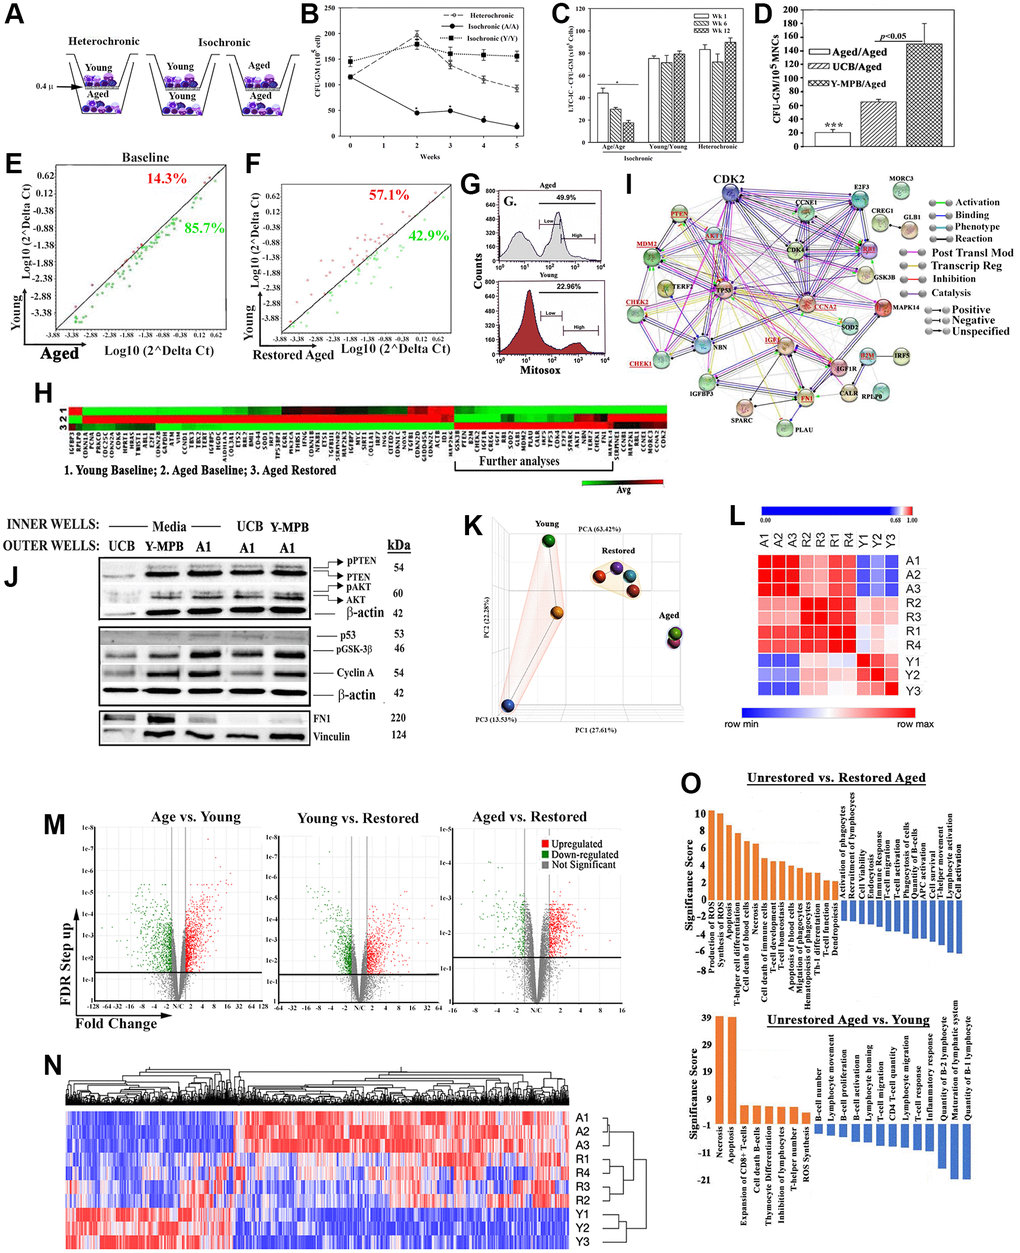
Figure 1.In vitro hematopoietic restoration of aged MPBs. (A) Cartoon shows the method employed for non-contact isochronic and heterochronic cultures. (B) Timeline clonogenic assays for CFU-GM with viable cells from isochronic (aged or young MPBs) and heterochronic cultures (restored aged MPBs). The results are presented as mean CFU-GM ± SD (n = 8 donors, each donor tested in triplicate with two young donors). *p < 0.05 vs. similar time points in heterochronic cultures; **p < 0.05 vs. time 0 and wks 2, 3 and 4. (C) LTC-IC cultures were established using the model in ‘A’ except for seeding the aged MPBs on confluent γ-irradiated BM stromal cells in the outer wells. Control cultures contained isochronic young or aged cells in both wells. At wks 1, 6 and 12, clonogenic assay for CFU-GM with aliquots of viable mononuclear cells. The values for each time point were plotted together (8 donors, each tested in triplicates, CFU-GM/105 MPBs ± SD. *p < 0.05 vs. heterochronic. (D) Heterochronic and isochronic cultures were established with 107 UCB in the inner wells. At wk 4, aliquots of aged MPBs were analyzed for CFU-GM and the results presented as mean CFU-GM ± SD for 5 different UCB, each tested in duplicate. ***p < 0.05 vs. heterochronic cultures with UCB. (E) Senescence-related gene expression was performed with 84-gene qPCR arrays using cDNA from restored and unrestored (baseline) aged and young MPBs. Gene expression for 4 donors was determined by calculating the ΔCt between gene-of-interest and housekeeping genes and then plotted as Log10(2ΔCt). Each dot represents the average gene expression for donors. Baseline comparison for unrestored young vs. aged MPBs is shown in red for higher expression in young and green for higher expression in aged. The line y = x indicates no change. (F) The analyses described in `E’ was performed for young and restored and the data are similarly presented. (G) Oxidative stress by MitoSox assay, delineated as MitoSox, negative, low and high by flow cytometry. (H) Hierarchical clustering with the array data from ‘E and F’. (I) The genes upregulated in the qPCR array in ‘H’ (open boxed region) were analyzed by RAIN to demonstrate predicted interactions. (J) Western blot (3 biological replicates) with whole cell extracts from unrestored young MPB (Y), UCB and restored A1 (restored with UCB or Y-MPB). SDS-PAGE: top, 15%; middle 12%; bottom, 6%. (K) PCA of RNA-Seq data from MPB (3 young, 3 age) and 4 restored MPBs. Lines highlight the groups. (L) Similarity matrix of ‘A’ for young, age and restored samples. (M) Volcano plot of differentially expressed genes. (N) Heatmap of fold changes with an FDR ≤ 0.05 as a cut off with linked significant pathways. (O) IPA-determined significant hematological functions with shown comparisons. See also Supplementary Table 1, Supplementary Figures 1 and 2.