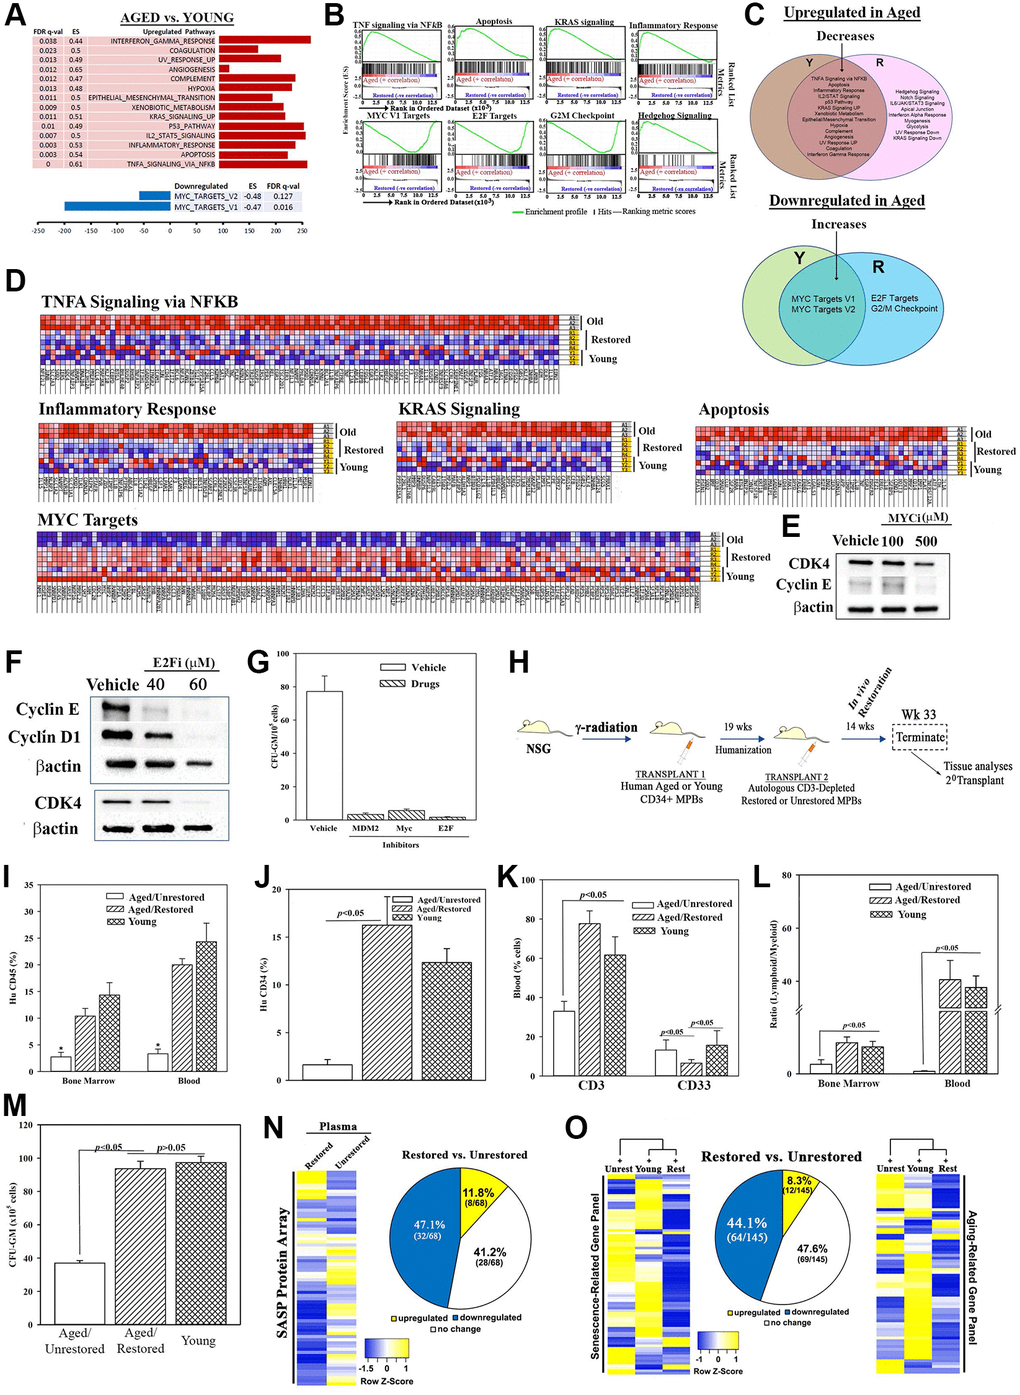
Figure 2.Molecular changes in age-related pathways following restoration. (A) Up- and down-regulated pathways in age, relative to young MPBs. (B) Enrichment plots for the top and down-regulated pathways. (C) Venn diagram shows shared and unique pathways between young and restored group, and overlap, changed pathways with restoration. (D) Enriched heatmaps of significant changes in ‘G’ (Full heat maps Supplementary Figure 2J). (E, F) Western blot for cell cycle proteins with extracts from 3 restored cells, MYC or E2F inhibitors or vehicle. (G) Clonogenic assay for CFU-GM with cells restored with 1 μM MDM2, 100 μM MYC or 40 μM E2F, mean ± SD (4 different aged donors, restored with 2 young donors; each in triplicates). See also Supplementary Figure 2). (H) Overview of NSG transplanted with aged huCD34+ MPBs. At the achievement of chimera, NSG with an aged hematopoietic system are injected with autologous restored (n = 12) or unrestored (n = 11) CD3-depleted MPBs. Serial transplantation used wk 33 huCD34+ cells. Controls were given young CD34+ cells (n = 8). (I–K) Flow cytometry for huCD45+ cells in BM and blood, *p < 0.05 vs. the other groups, (I), huCD34+ cells in BM (J), huCD3+ and huCD33+ cells in blood (K), mean % cells ± SD. (L) Lymphoid (CD3++ CD19+)/myeloid (CD33+) ratio in BM and blood. (M) CFU-GM in cultures with huGM-CSF and huIL-3 and huCD45+ cells from BM, mean ± SD. (N) SASF array with huNSG plasma. Semi-quantitative densitometry used 1.5-fold cutoff for classification as up- or down-regulated, or no change. Heatmaps and piechart for differential gene expression. (O) RNA from huCD45+ BM cells evaluated qPCR gene arrays. Normalization to housekeeping genes used 1.5-fold cutoff, mean ± SEM. *p ≤ 0.05 vs. control. See also Supplementary Figures 2 and 3.
Figure 2 — Restoration of aged hematopoietic cells by their young counterparts through instructive microvesicles release | Aging