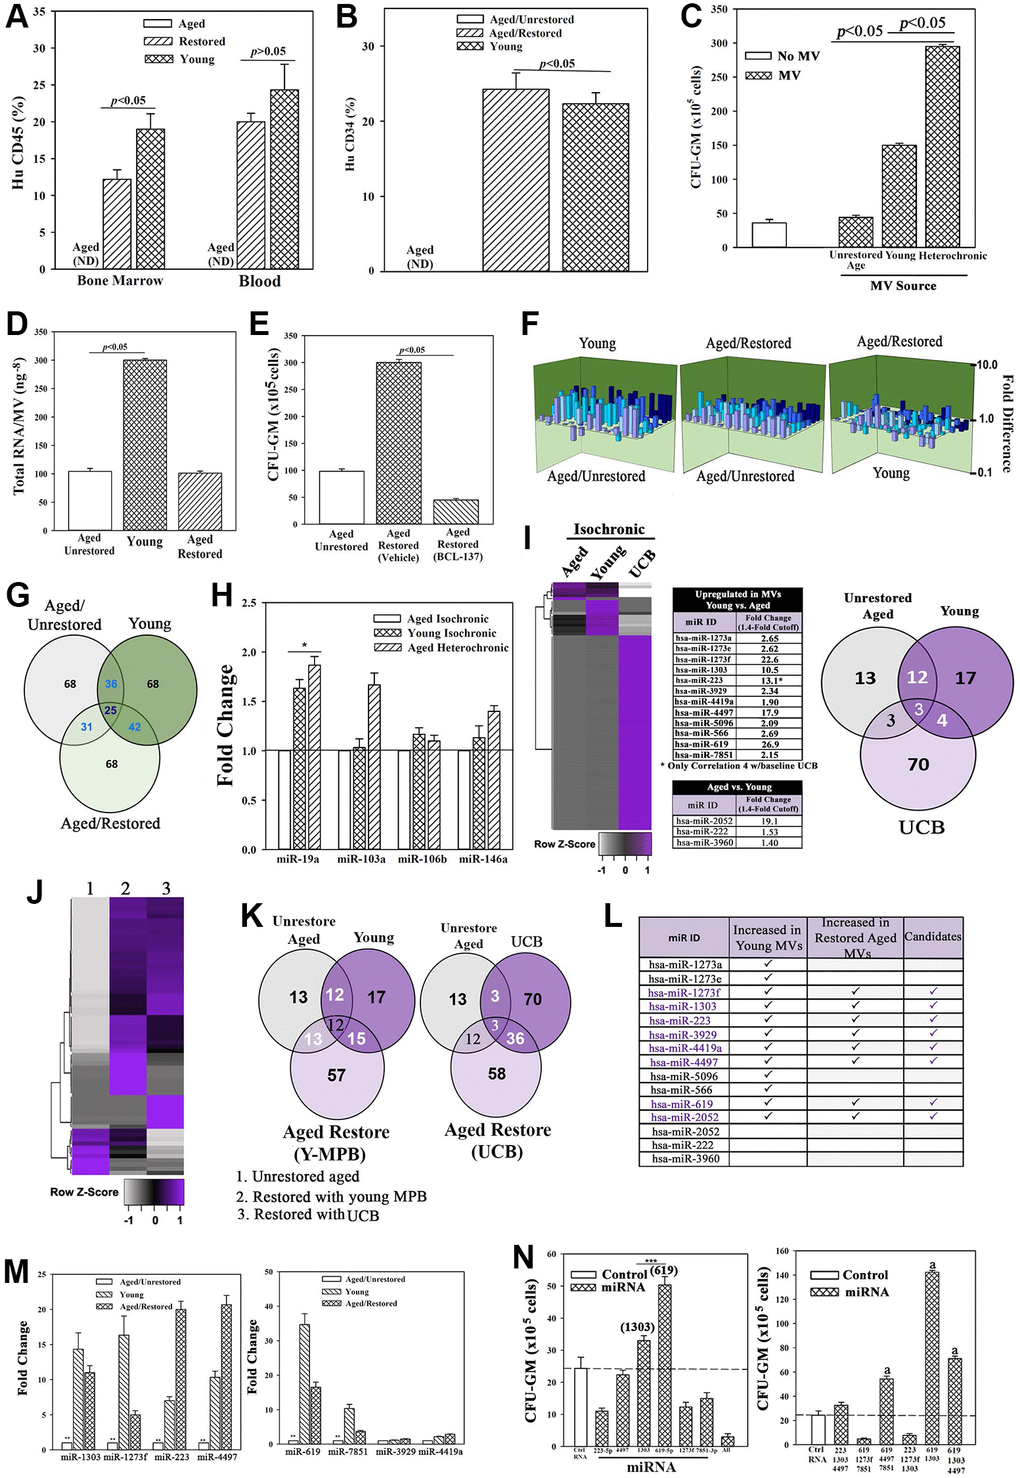
Figure 3.Restored cells transplanted in NSG mice with aged human hematopoietic system (huNSG) and exosomal RNA in restoration. (A and B) HuCD34+ cells (105), pooled from wk 33 mice (Figure 2H) were injected into naïve NSG mice (n = 3). At 12 wks, mice were analyzed for huCD45+ and huCD34+ cells. ND = none detected. (C) Pooled MVs (106) from heterochronic or isochronic (young and aged) cultures were added to naïve aged MPBs on day 0 and 4 and at day 7, CFU-GMs were assessed in clonogenic assays, mean ± SD, n = 5. (D) Total RNA in MVs isolated from heterochronic cultures, ng-8/MV ± SD, n = 8. (E) BCI-137 or vehicle was added to heterochronic or isochronic cultures, CFU-GM ± SD, n = 5. (F) 3D plots with data from qPCR miR array data using RNA from MVs. (G) Venn diagram showing differential and overlapping miRNAs. (H) qPCR for differentially expressed MV miRs. Shown are the consistently upregulated miR in young isochronic (dark green bar) and heterochronic cultures (striped bar), mean ± SD, n = 3. Aged isochronic cultures were assigned a value of 1. *p ≤ 0.05 vs. control. (I) MiRnome sequencing used small RNA from MVs of aged and young MPBs or UCB. Heatmaps used miRNA, > 1.4-fold between aged and young samples. Venn diagrams depicts the differential and overlapping miRNAs. (J, K) Studies, similar to `I’, compared miRNAs, sequenced from MVs of aged isochronic and heterochronic (cultured with young MPB or UCB) samples. (L) The 12 miRs showing differential expression between aged and young in ‘I’ were compared to miRs that were increased in heterochronic vs. aged isochronic cultures (I, J). Shown are the increased 8 miRs in restored cells. (M) qPCR for the 8 miRs, 7 biological replicates, each in triplicate. The data are normalized to miR-7641-2 and presented as fold change using 1 for aged control. (N) 6 validated miRs or control miRs were expressed, alone (left) or together (right) in 5 biological replicates, each in triplicate. CFU-GM at day 7, mean ± SD. *p ≤ 0.05 vs. control. See also Supplementary Figures 3 and 4.
Figure 3 — Restoration of aged hematopoietic cells by their young counterparts through instructive microvesicles release | Aging